qlik

Choosing a service provider for Qlik projects management

Git is a distributed file version control and collaboration system that was developed in 2005 by Linus Torvalds. The developer explains its name (git) with a bit of sarcasm: «I am a selfish scoundrel, and therefore I name all projects after myself. First Linux, now git.»

Now Git is the most popular and free tool that is a set of command line utilities. It allows to track the history of software development and work with entire teams from anywhere in the world on one project. Each change is added in the form of commits that allows to track, revert the change if it’s necessary and revert to previous versions.

In addition to being comfortable, flexible, and able to maintain development history, using Git greatly reduces development errors and data loss. Similar SCM version control systems are Mercurial, Subversion, Darks, Bazaar. However, Git has some advantages:

Git main tasks:

The use of Git is carried out with the help of special hosting and repositories.

GitHub was created in 2008 and bought out by Microsoft for $7.5 billion in 2018. GitHub is a source code hosting site and a large social network for developers with 20 million users who can view each other’s code, help to develop, and leave comments, and 80 million repositories worldwide. Users can create their own repository and publish their work. Free use is possible only for public open-source projects. The platform is written in Ruby on Rails and has a large number of open-source projects available to the public.

GitHub benefits:

GitLab is an alternative to GitHub and is a web repository that provides free public and private repositories. GitLab was developed by 2 Ukrainians: Dmitry Zaporozhets and Valery Sizov, using Ruby and some parts of Go. The architecture was later enhanced with Go, Vue.js and Ruby on Rails.

GitLab is a complete DevOps platform for project planning, source code management, monitoring, security, and more. It also offers wiki hosting and a bug tracking system. Using GitLab significantly shortens the product life cycle and increases productivity. This, in turn, adds value to the customer.

Gitlab benefits:

BitBucket is an analogue of GitHub that is designed for hosting projects and their joint development. The service was developed by the Australian company Atlassian, which created Jira and Confluence. It allows to create public and private repositories based on Git technologies for free, has the ability to integrate with Jira and Snyk, and built-in CI/CD capabilities. The service is a great solution for small teams.

BitBucket benefits:

Jenkins is an open-source system based on Java. It provides automation of software development process parts without involving people and the process of continuous software integration. Jenkins is widely used in companies where there is a need for automatic applications deployment. The system is free, runs on Windows, macOS and other Unix-like operating systems, as well as has integration with Docker and Kubernetes. Jenkins does not contain a repository with source code, but connects to existing ones via web hooks. Thus is a universal tool for CI/CD regardless of the chosen hosting of remote repositories.

Jenkins benefits:

QOps can work effectively with all the above services.

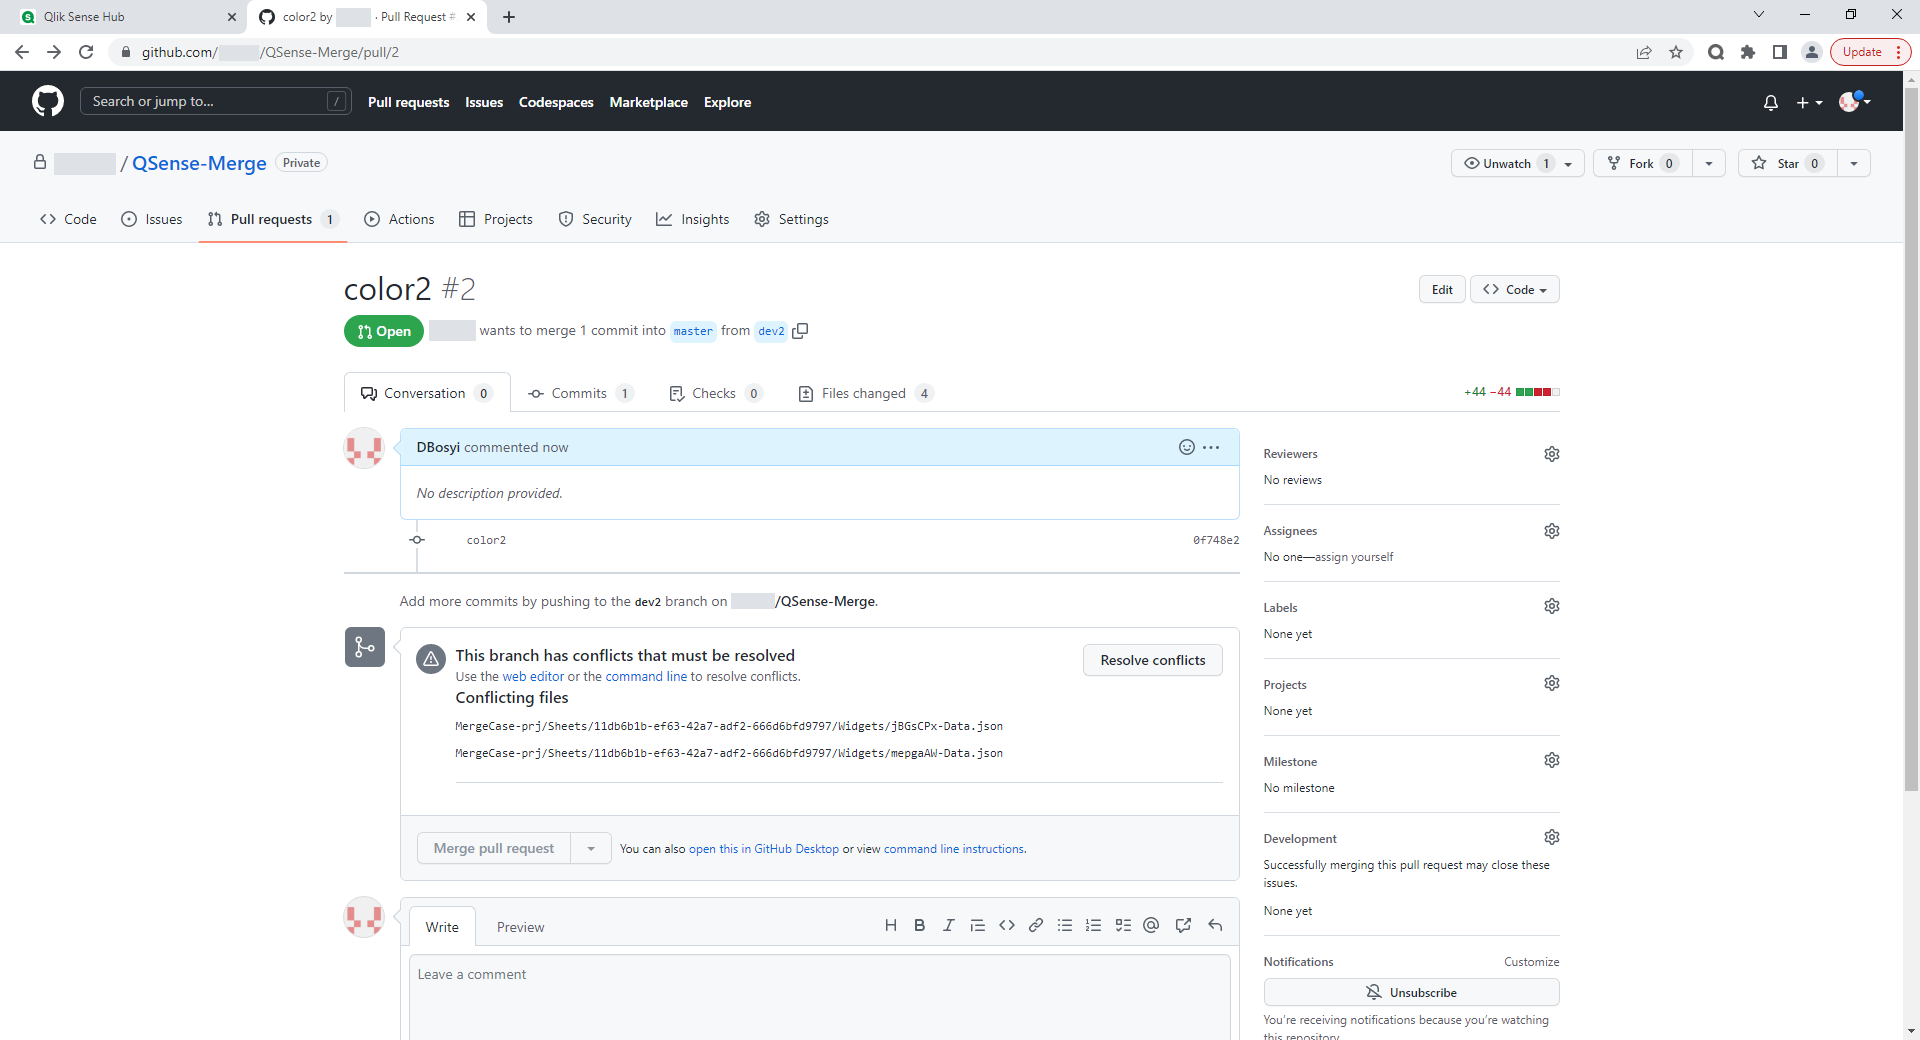
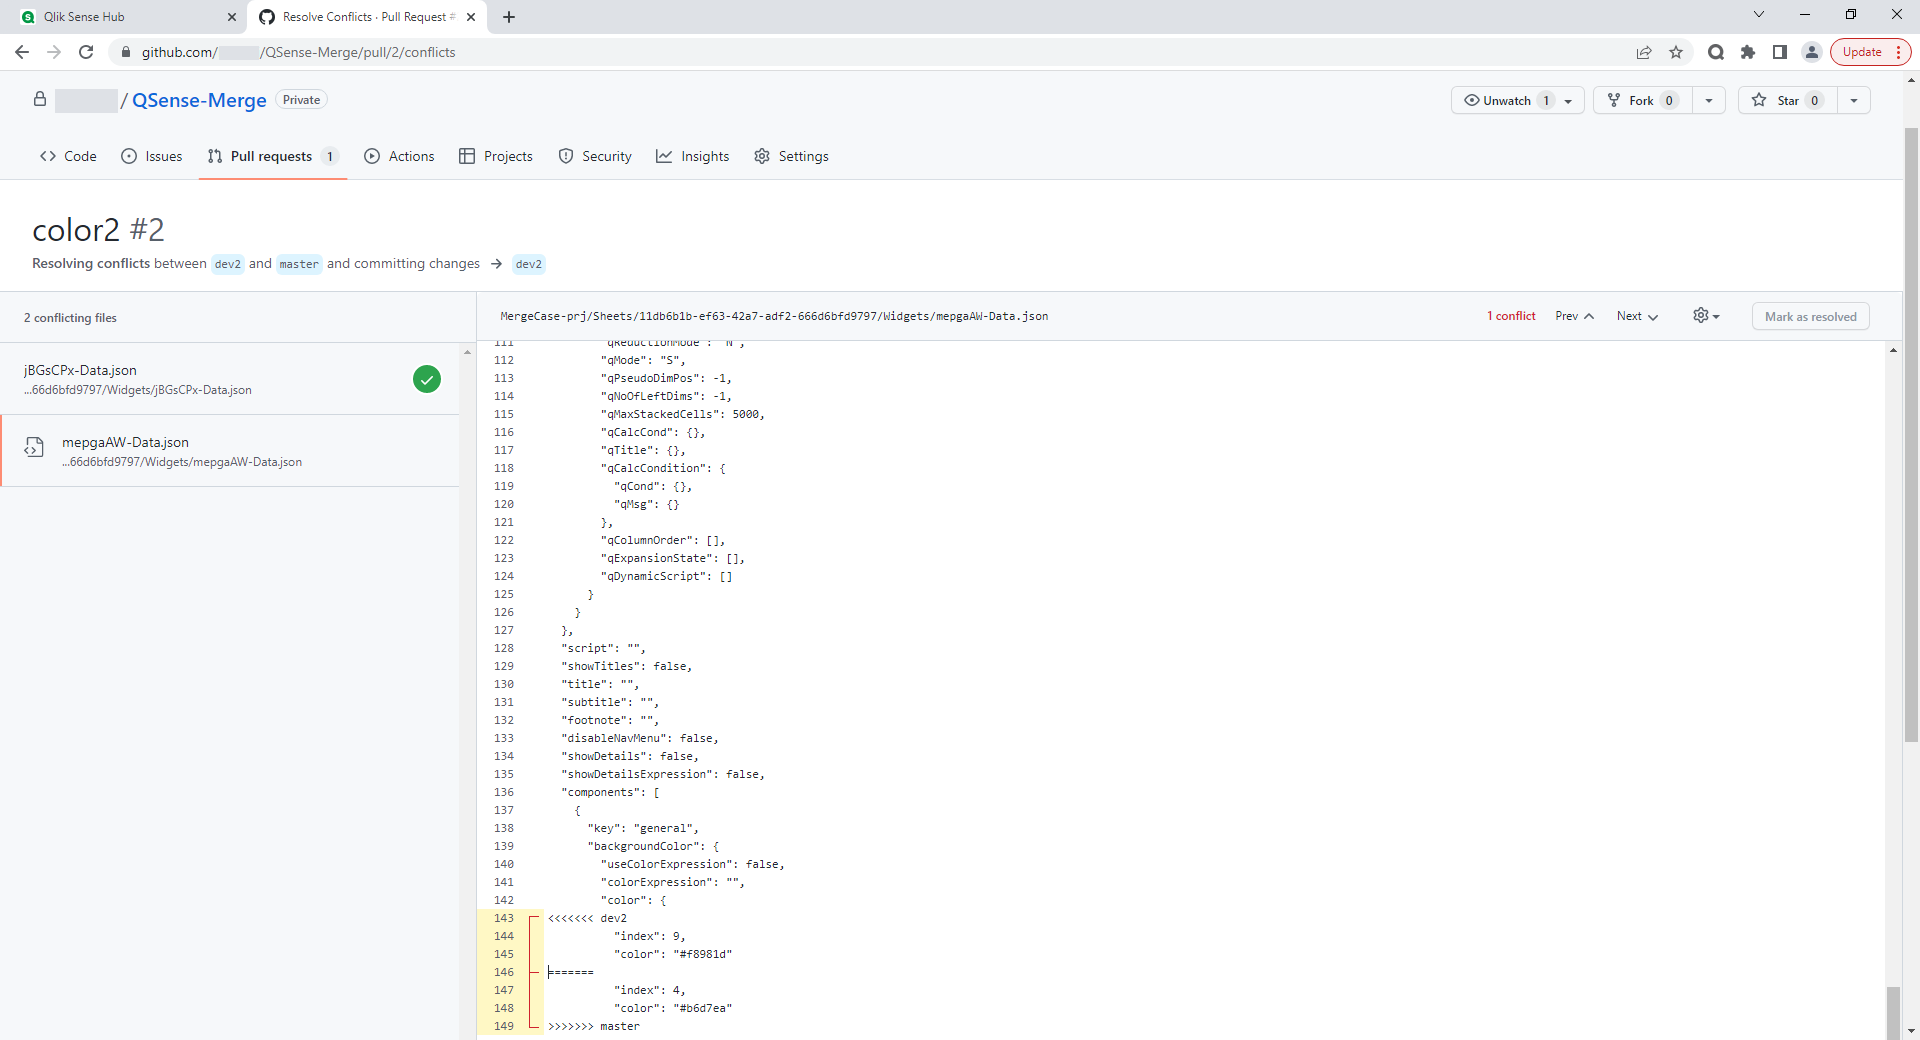
GitHub and GitLab include the ability to install runners that will later execute commands from a .yml file included in the source code repository when a certain event is reached. Usually such an event is sending source codes (push) or merging branches (merge) in a remote repository. At the same time, the syntax for compiling .yml files is slightly different, although it describes the same essence of runner behavior and managing the process of application building, testing and subsequent deployment. Both hosting systems allow to install their runners in a Windows environment that is not yet available for BitBucket hosting.

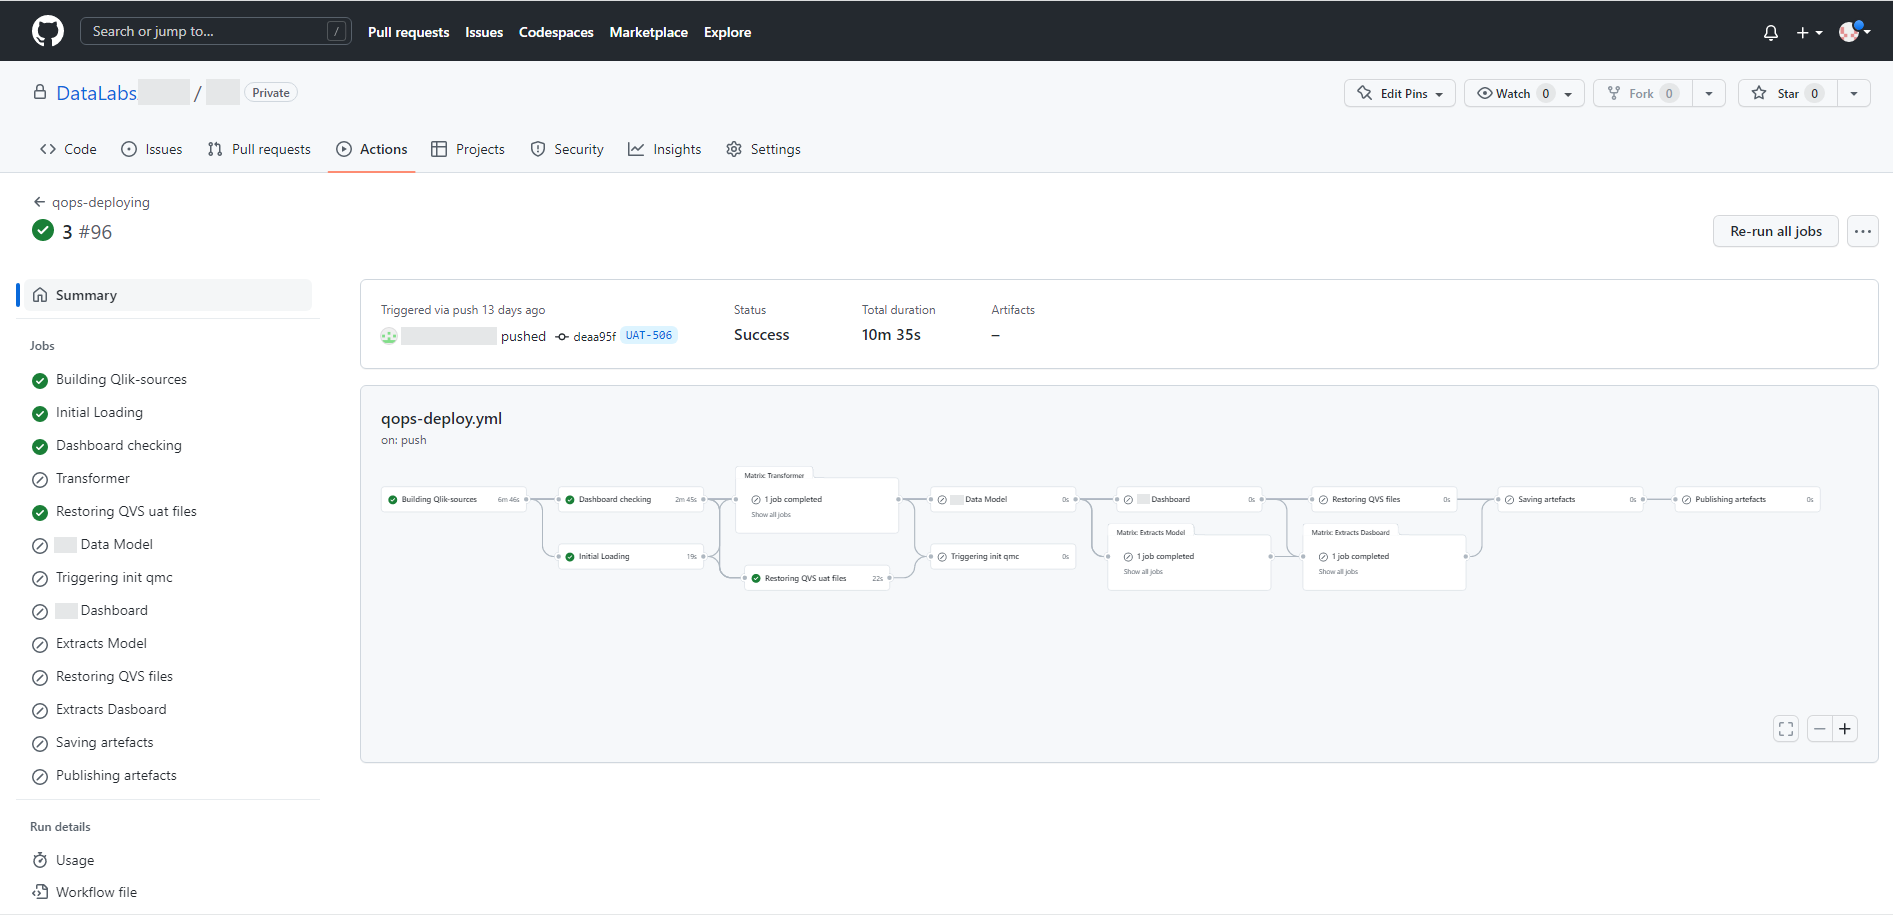
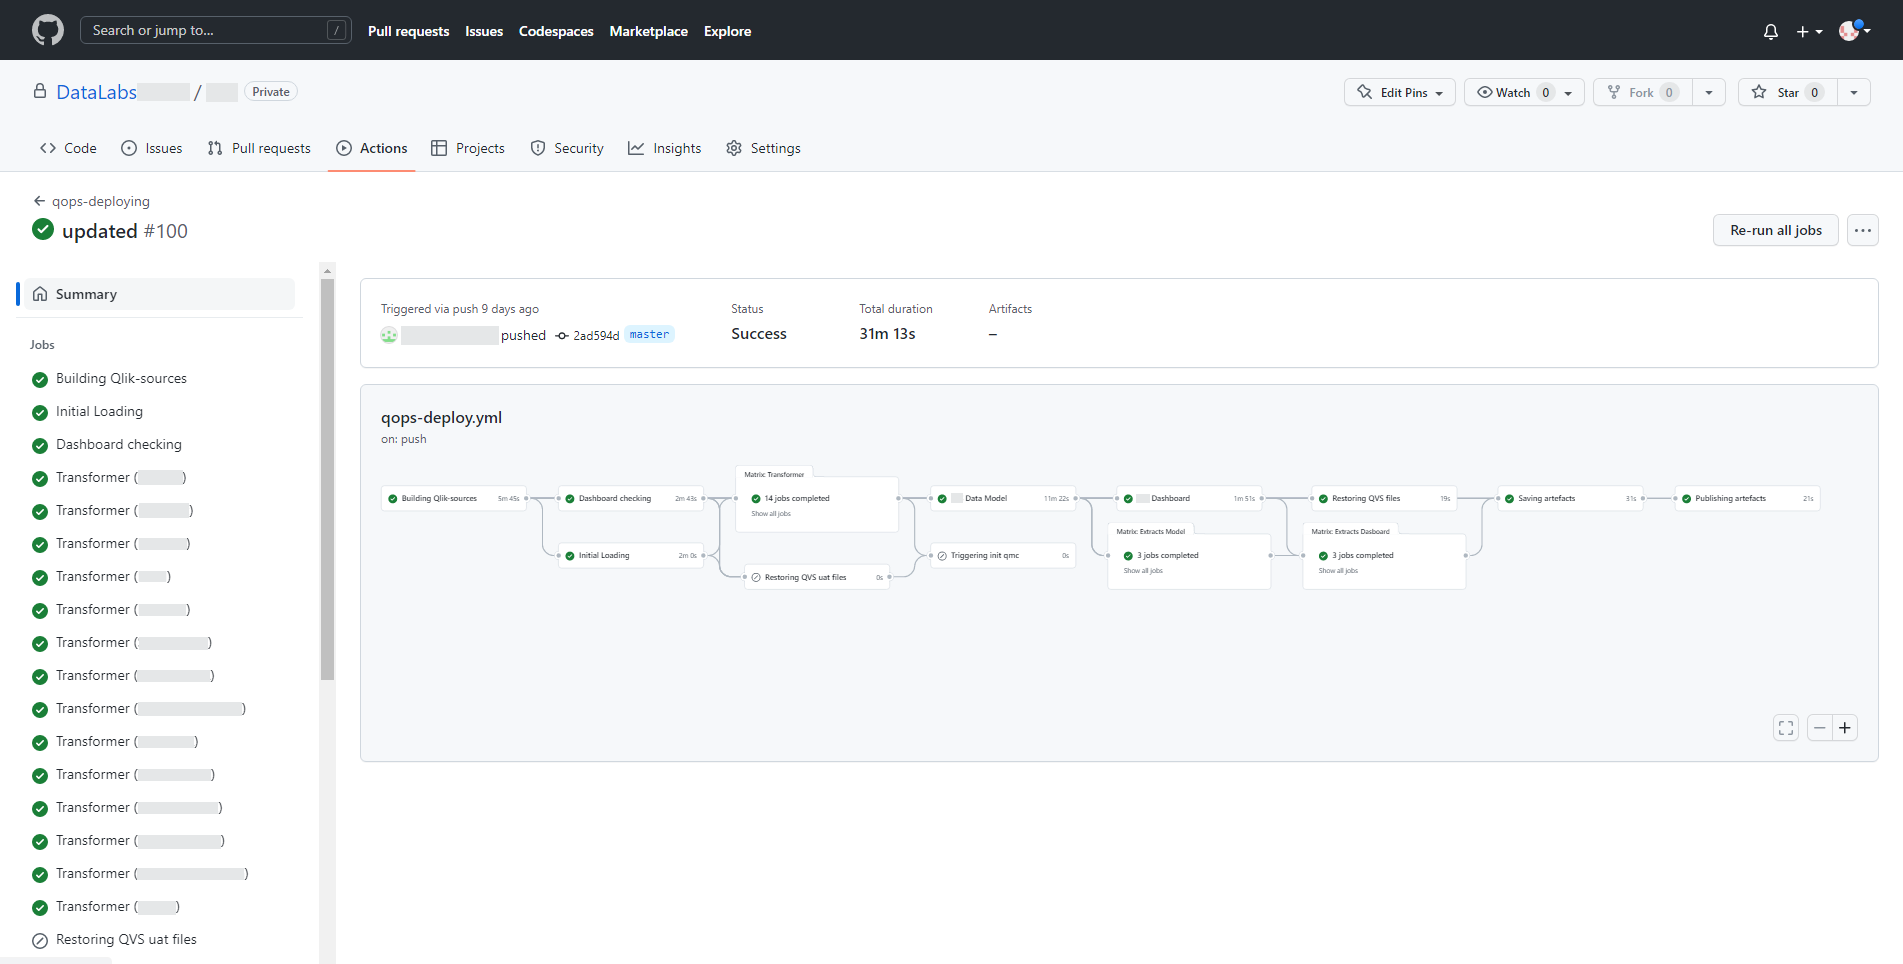
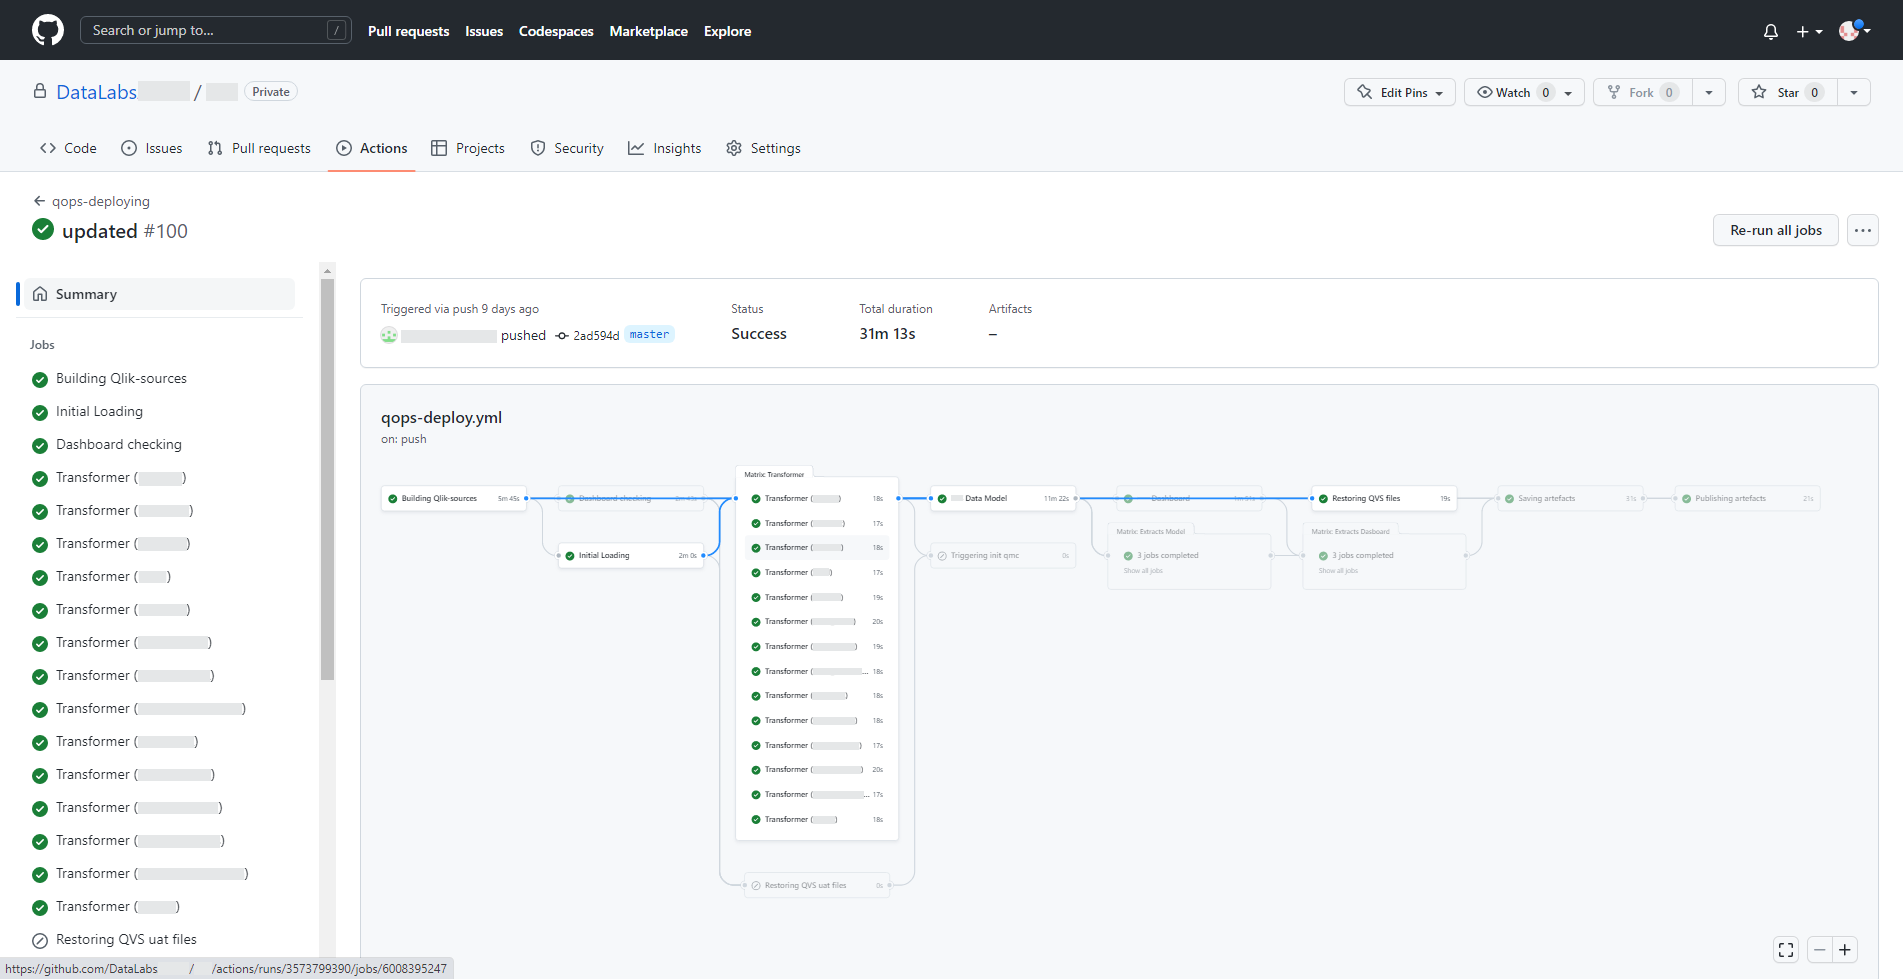
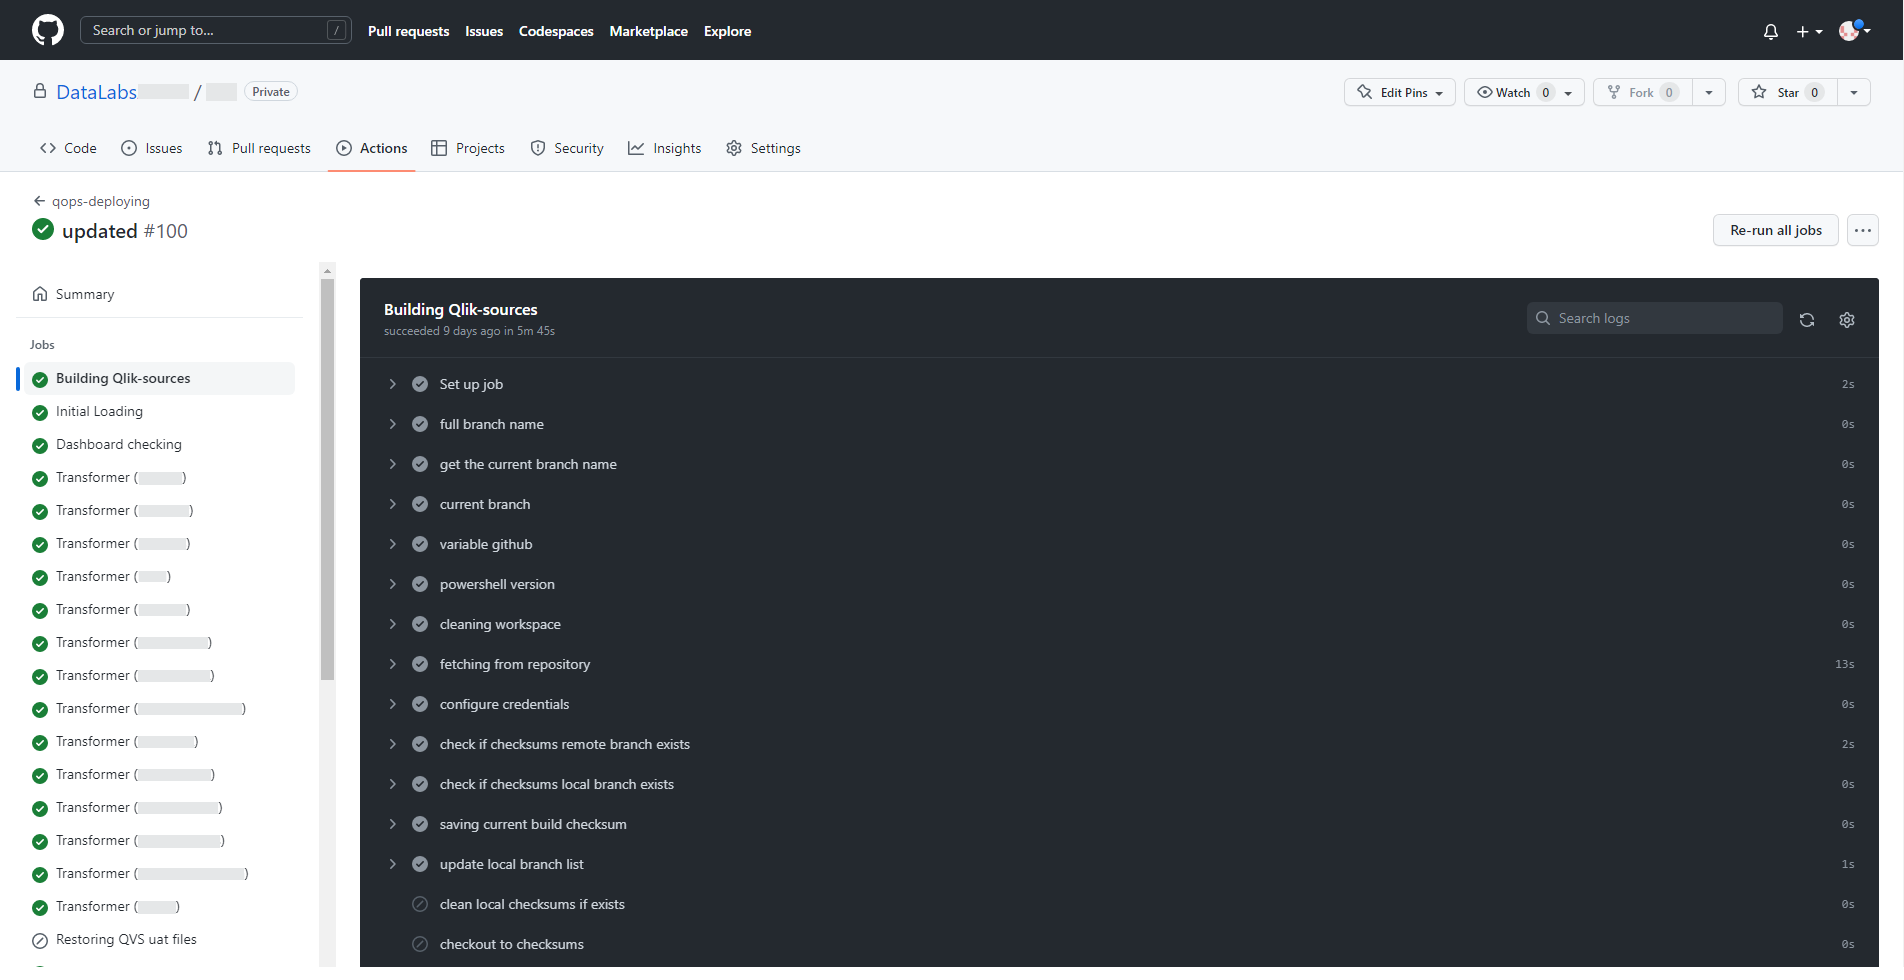
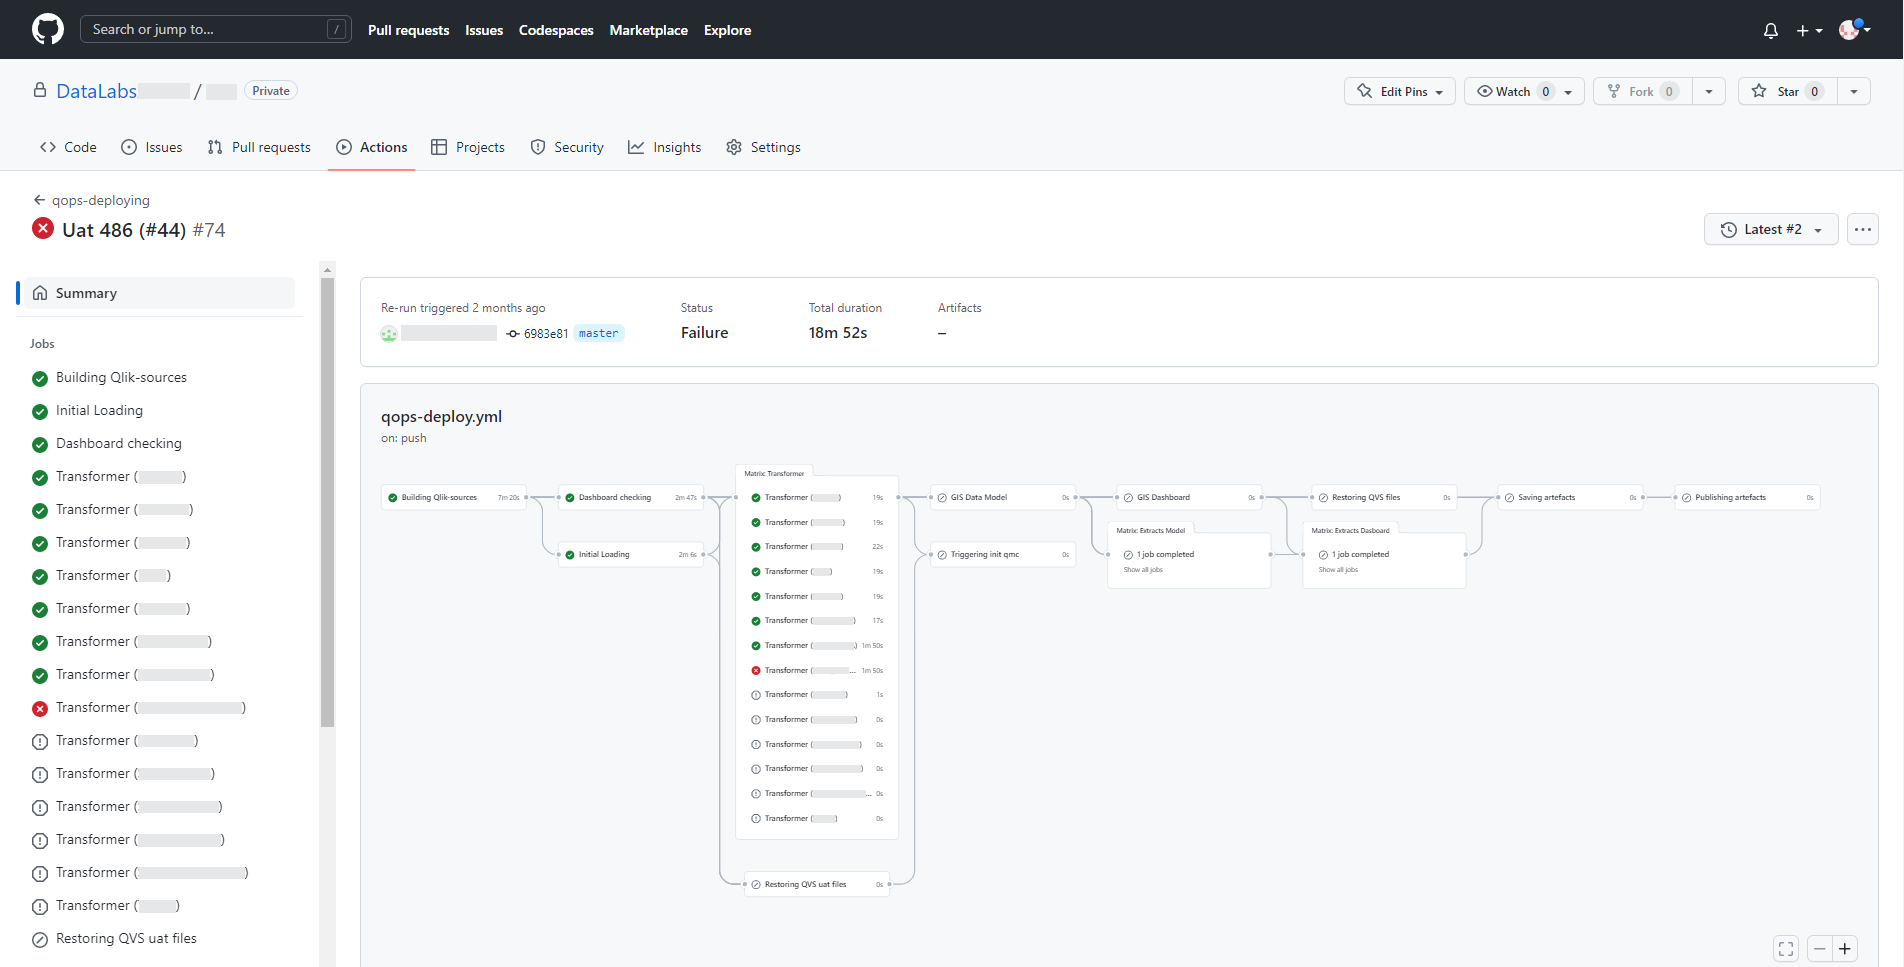
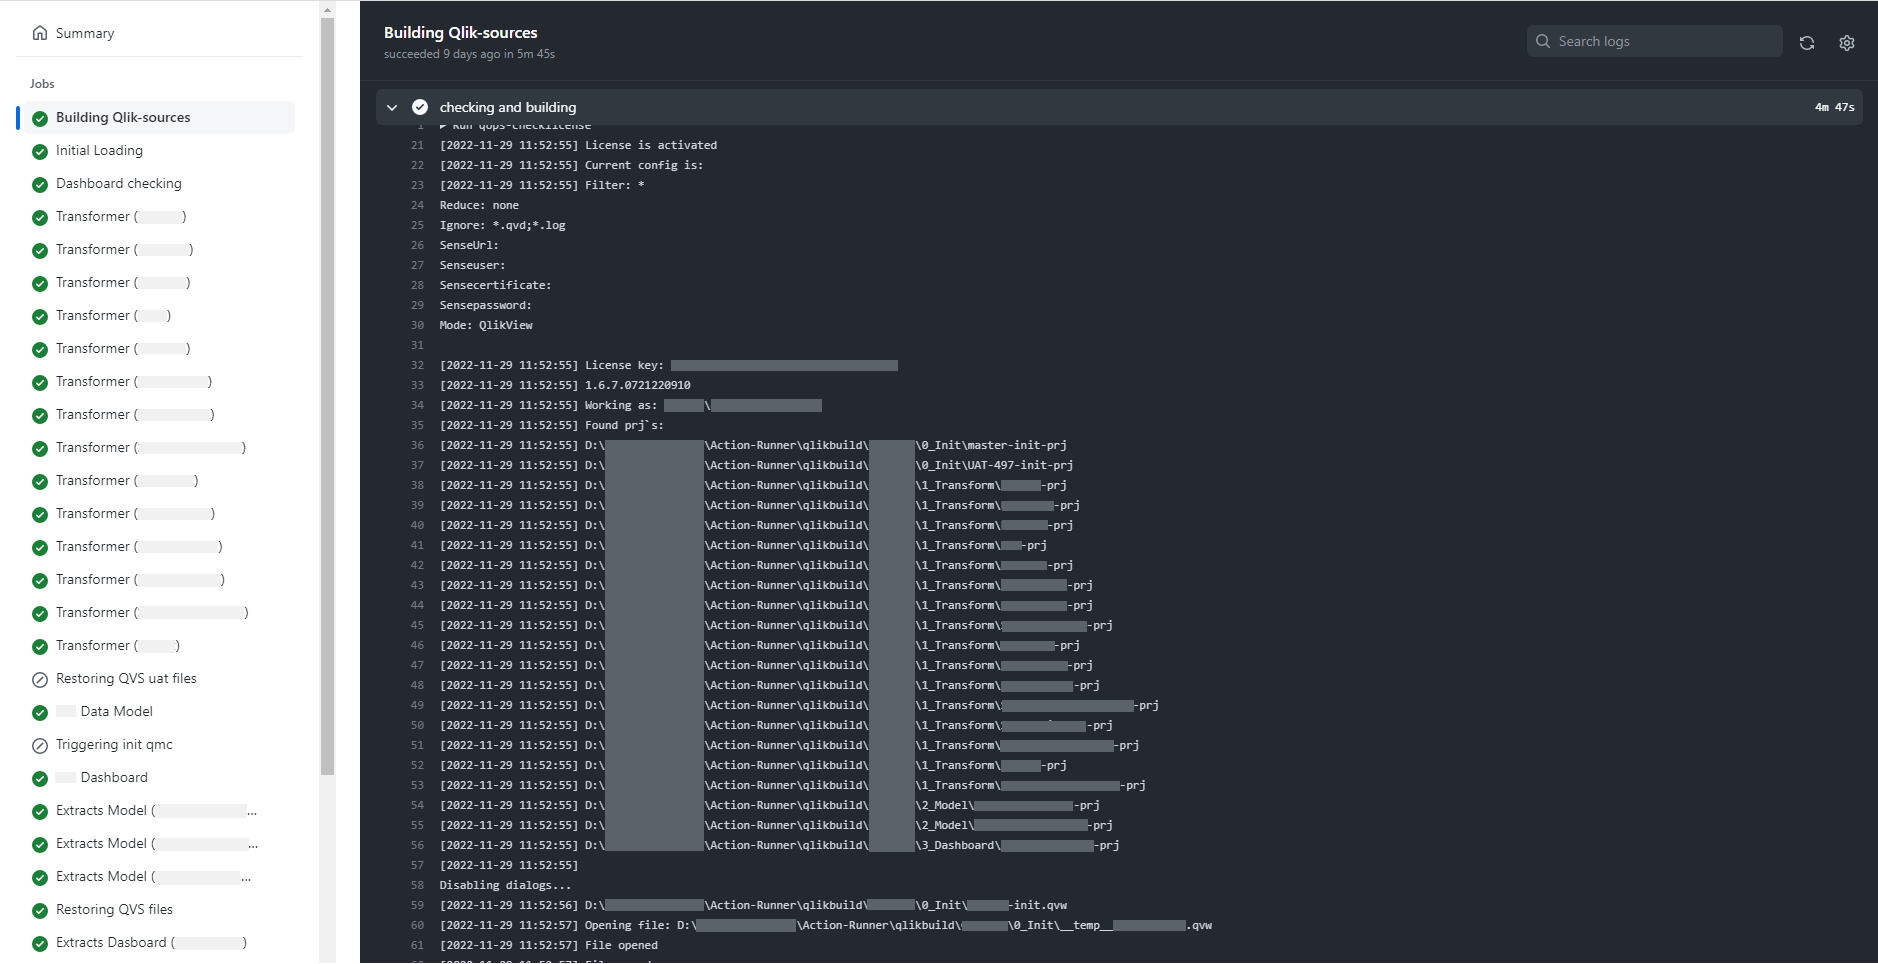
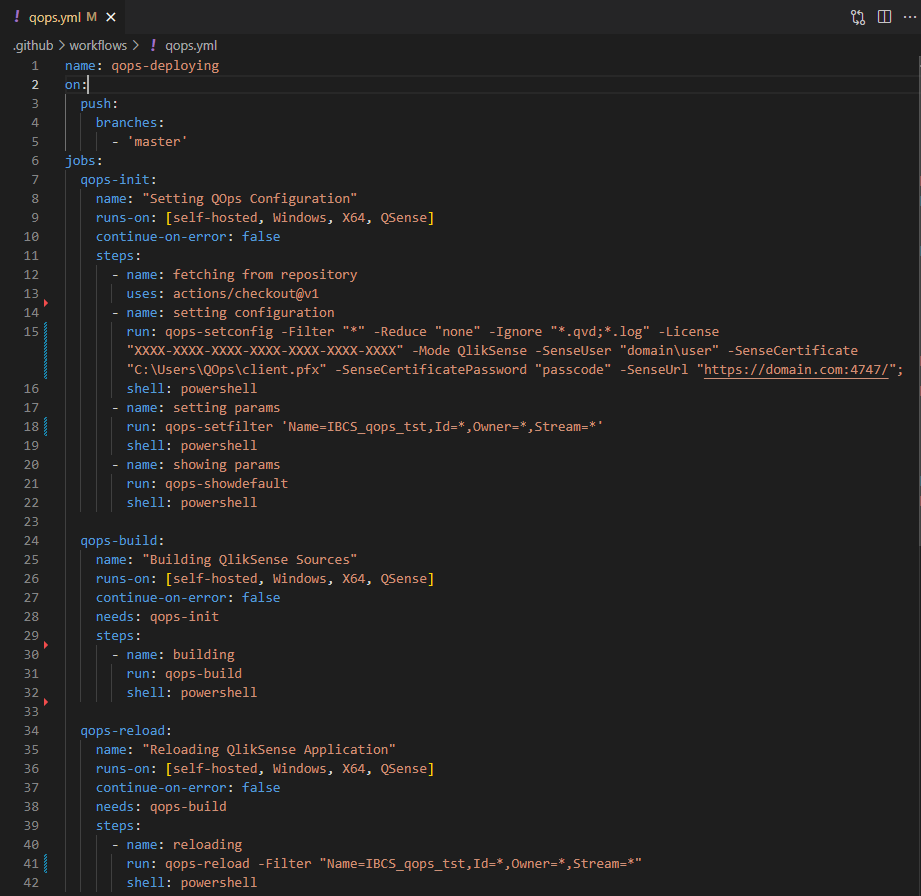
Below is QOps usage with the above systems. For GitHub, a .yml file is a structured steps set that consists of successive steps. The example below describes 3 steps – init-build-reload.

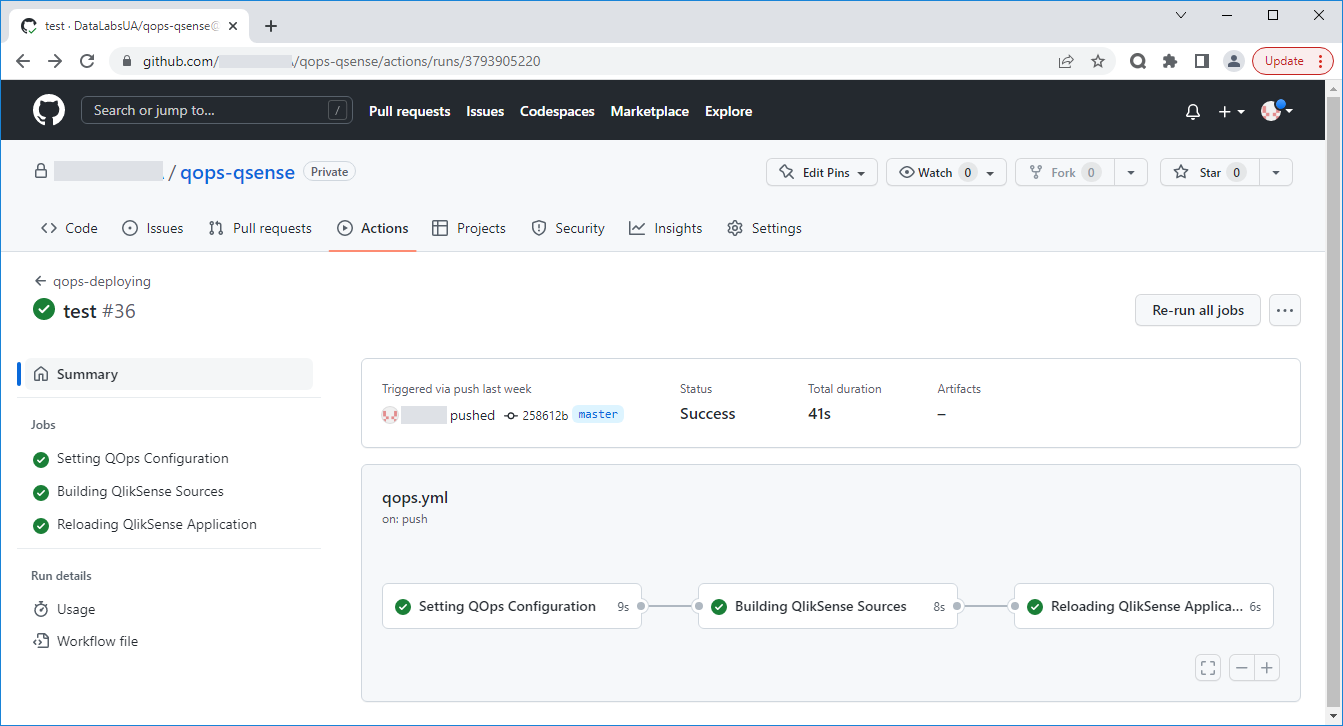
Successfully executes pipeline looks like this.

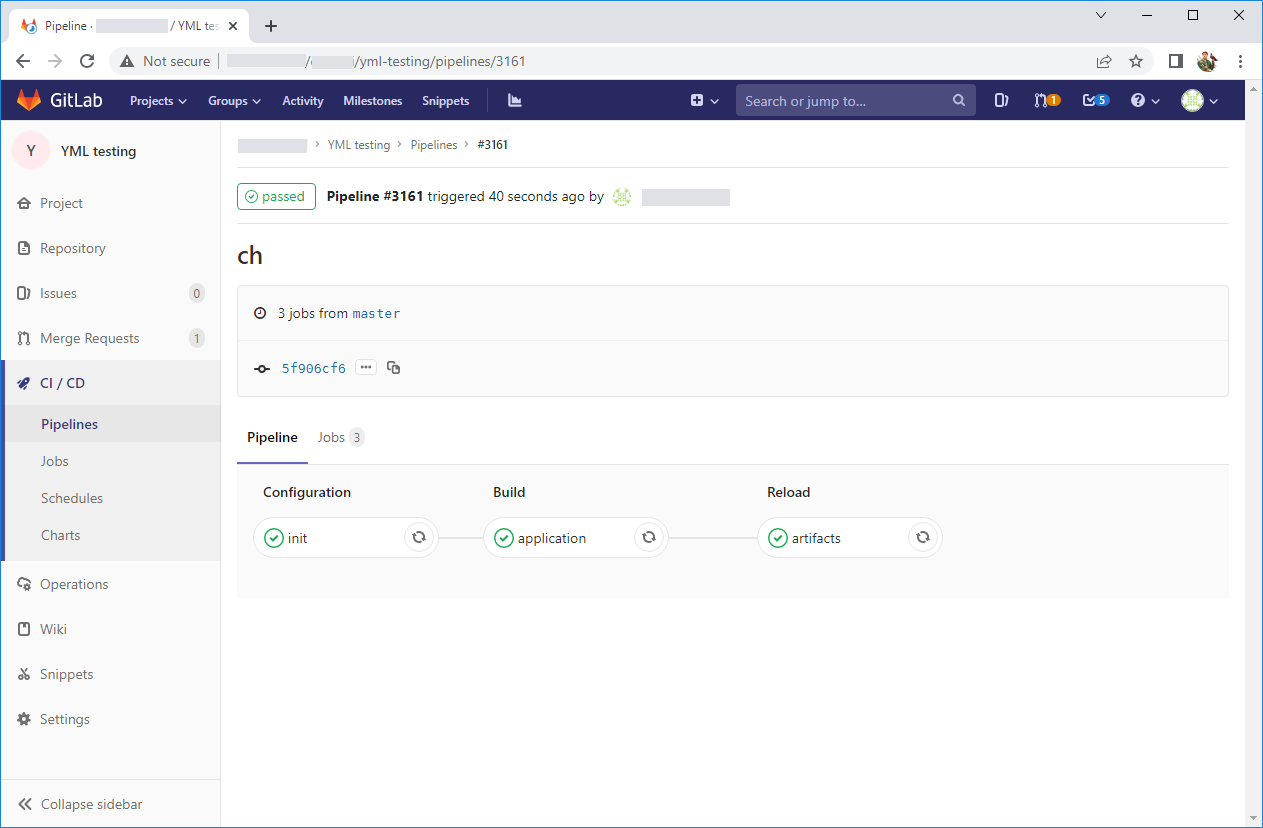
For GitLab, the .yml file is the same structured steps set, the differences are a different name for the keywords and more flexible work with variables. Unfortunately, developers don’t use a unified .yml file format and there is no interoperability between them.

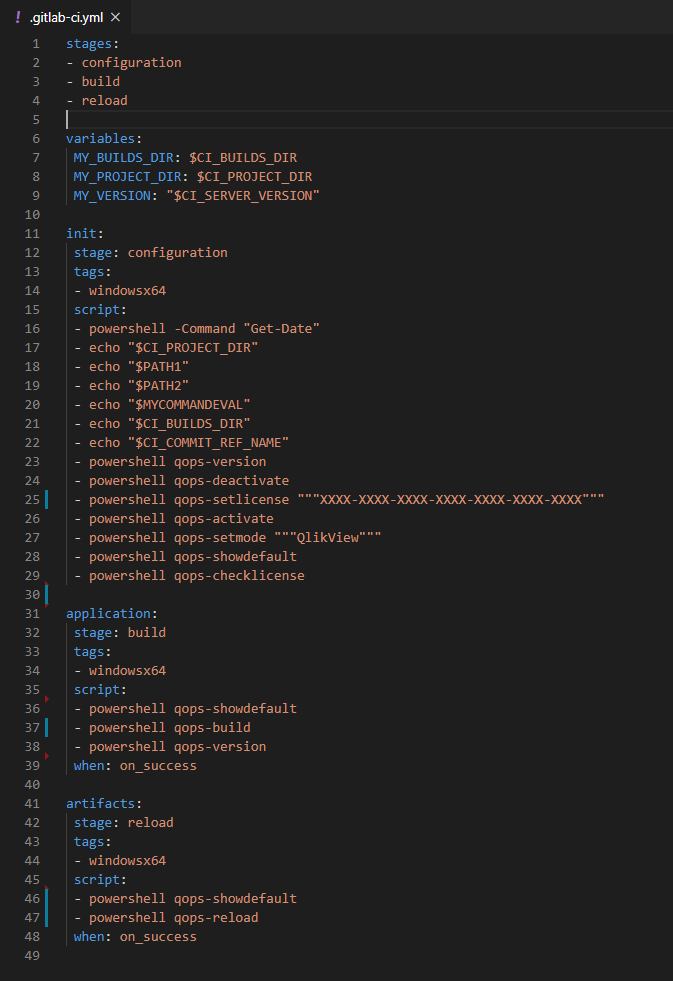
Upon successful completion, a pipeline view consisting of the same stages is presented below. It is worth noting here that GitLab has more developed interactivity. For example, in the pipeline, it’s possible to set up manual confirmation from the user.

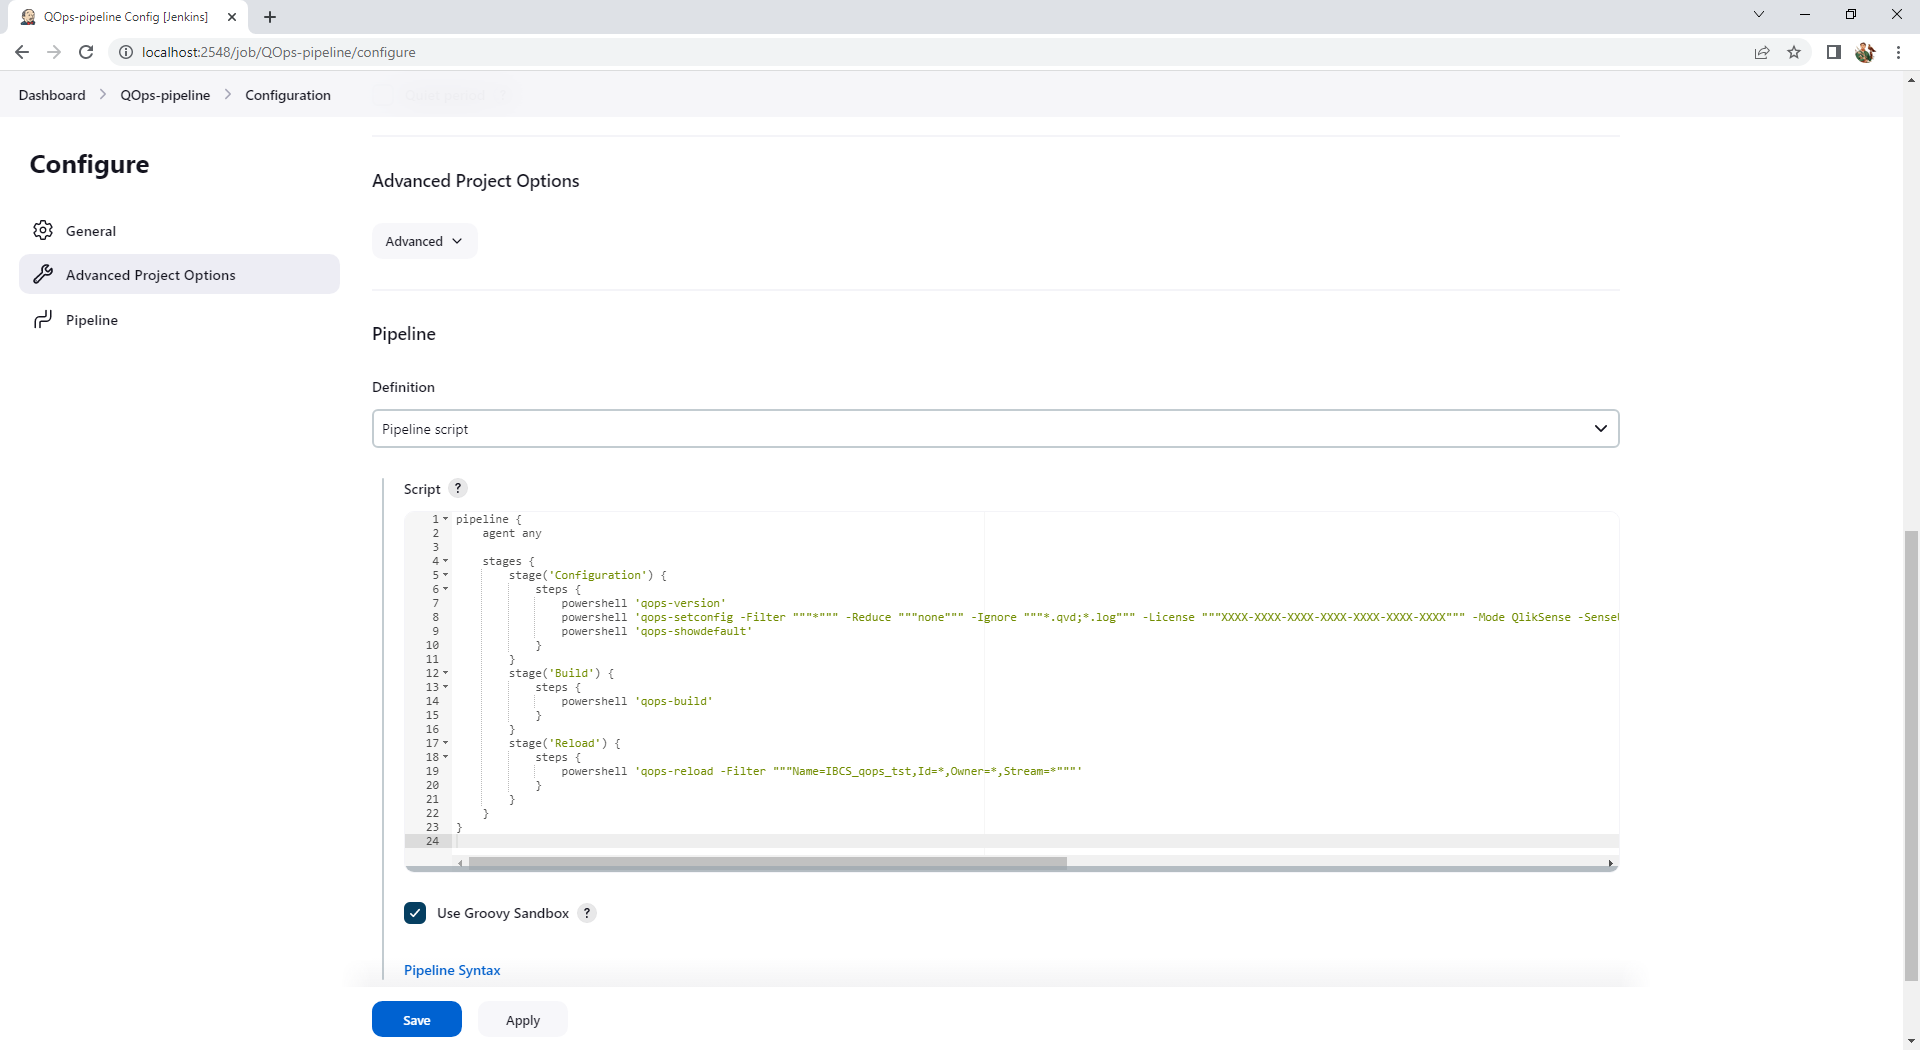
QOps currently works exclusively in the Windows environment. If BitBucket is chosen for source code hosting, the automatic pipeline can be developed using the Windows version of Jenkins. The versatility of the latter and plugins variety allows to link any remote repository through web hooks. The pipeline structure is written as a JSON object, if configured through the interface of Jenkins itself. And for our example it contains all the same 3 stages – Configuration-Build-Reload.

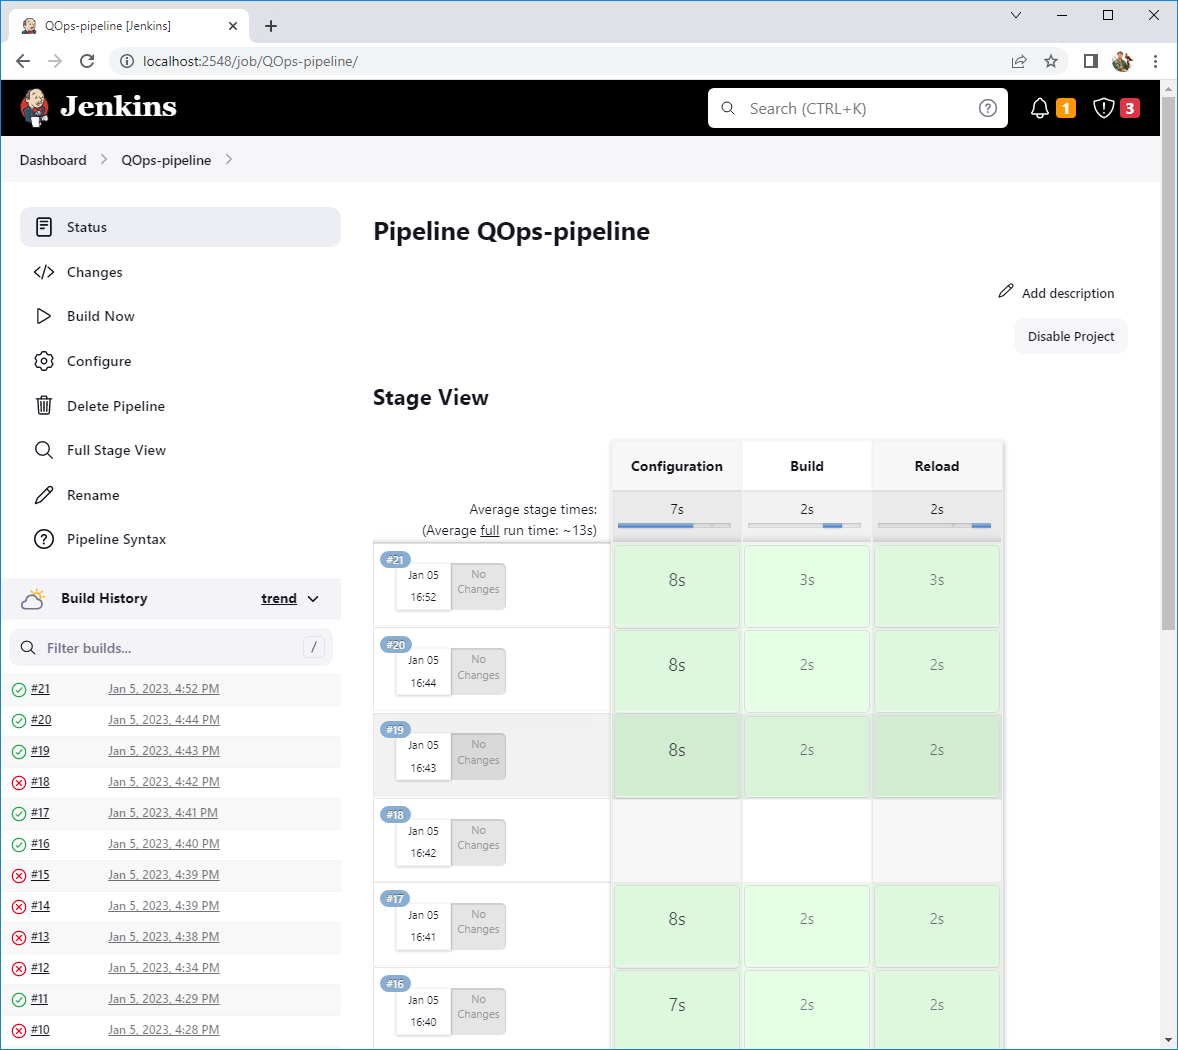
The result of successful pipeline execution in Jenkins is shown below. At the same time, the interface compares the results of previous launches in an interesting way.

More information you can find at the link

Branching strategy for large Qlik projects

Speed and flexibility of software development play an important role. However, with a large development team working at the same time, branching and merging code can get messy. These teams need to be provided with a process to implement changes concurrently. An effective branching strategy is a priority in resolving this issue.

A branching strategy is a set of rules that developers follow when writing, merging, and deploying code when using version control. In situations where multiple developers are working and adding changes at the same time, the branching strategy structures the repository and avoids merge confusion. Merge conflicts hinder rapid code delivery and hinder the creation and maintenance of an effective DevOps process.

Thus, the branching strategy creates a clear process for making changes to the system. This helps to solve this problem and provides the ability for multiple developers to work in parallel and independently to release faster and minimize conflicts.

The branching strategy allows to:

The branching strategy is an important working tool. Arbitrarily creating branches in Git by different developers can lead to chaos. A branching strategy will allow to redirect attention to the development process itself, rather than version control.

Branches in Git are represented by tags or pointers. All changes are tracked as a directed acyclic graph, each node of which is a set of changes made simultaneously. Git branches provide developers with the ability to deviate from the master branch and create separate branches to isolate code changes. The default branch in Git is «main branch». The main advantage of a Git branch is its «light weight». That is, the data consists of snapshots series, and each time Git commits changes. It takes a snapshot of the current files state and keeps a link to this one. Such branches are not just copies, but also a pointer to the latest commit.

Basic Git branching strategies:

An example of a merge conflict and its resolution

Let’s look at an example of a merge conflict and possible ways to resolve it using QOps to control versions of a Qlik Sense application. Let’s take a Qlik Sense application and use QOps to create a source code repository and 2 branches dev1 and dev2 for individual developers. Imagine a situation where each of the developers changed some common element (for example, the background objects color with the output of KPI values).

Since the changes occurred on the same lines at the source level, when merging dev1 -> master and dev2 -> master, a merge conflict occurs in the last variant. Resolving a merge conflict requires deciding which of the options should be present in the reduced version. The VSCode development tool allows to interactively make this decision. However, this puts additional responsibility on the IT specialist who will perform the merging.

There is a risk of receiving from both developers code parts for a common element in a final application that may not be compatible. For example, after a merge, it is possible to get the following result when the first object is set to Accept Incoming and the second is set to Accept Current.

It is convenient to merge source codes using the web interface of version control systems. Below is the progress of a Pull Request on GitHub with a conflict-free merge.

The presence of conflicting changes leads to the output of the corresponding warning and additional information.

GitHub interface allows to resolve merge conflicts in small files, while the user needs to manually edit the source code marked as conflicting and confirm the changes. If this operation can’t be performed through the web interface, GitHub will ask to resolve conflicts locally.

Also, let’s resolve the existing conflict in the opposite way. As a result, we get the expected result with the opposite coloring of common elements.

Detailed QOps information here

Benefits of using CI/CD in Qlik application development

Continuous integration (CI – Continuous Integration) and continuous delivery (CD – Continuous Delivery) are one of the typical DevOps practices that allow developers to deploy software changes reliably and quickly. The key difference from manual development lies precisely in the automation of testing and code assembly.

For a long time, due to tools lack in the Qlik ecosystem for fully extracting application source code and its corresponding automatic assembly from source codes, the practice of CI / CD approach implementation was not available for developing and effectively managing projects based on Qlik technologies.

For Qlik developers QOps utility provides opportunities that were previously available to all other developers using a git repository for storing source codes and configured runners for automated tests and deployment.

Let’s take a look at the main aspects of the concept of CI / CD as a DevOps practice

Continuous Integration. Developer regularly makes changes in the applications development process. And these changes are uploaded to the repository. Automated testing and verification are provided through special tools such as events, that initiate the integration as a process consisting of stages and steps set. The execution of each step is accompanied by logging, that reflects all changes.

Continuous delivery automates deployment in any environment (production, test environment, development environment). Automated testing and deployment process provide developer with opportunity to focus on improving the software.

The advantage of CI/CD is to reduce the time spent on developing a software product, minimizing and identifying errors and defects in the early stages of code creation, reducing the time to correct errors, and reducing feedback cycles.

For example, there is a site that displays sales analytics for a certain company. The architecture of this solution includes a backend (can be represented by a database with a specific ETL process for data processing) and a frontend (in the case of using Qlik technology, the frontend is provided by an installed web server). During development and updates, individual developers make changes to one or both parts. Then changes are merged into the repository at the source code level, go through the entire pipeline and, ultimately, the changes are reflected immediately in the entire product.

CI/CD cycle stages:

  1. Creation (writing a certain part of the code and subsequent testing; after successful testing, code parts are combined into one whole and transferred to the working development branch);
  2. Assembly (version control implementation using Git, automatic assembly taking into account changes and received code testing);
  3. Testing (code verification implementation by a team of testers);
  4. Release (code transfer to release, creation of a working build to update the current version of the product);
  5. Deployment (broadcasting the update on the developers’ servers to update the software to the latest version);
  6. Support (monitoring user reviews);
  7. Planning (creating a list of changes for future versions).

Using QOps in the Development Life Cycle of a Qlik Application

Automation of integration and deployment processes is performed by the installed GitHub/GitLab runner, that is integrated with a repository. Bitbucket automation tools can also integrate with the Jira tracking system. It simplifies the task management process, makes it possible to see in which repository branch the desired update is located and follow its further progress. To receive commands from a runner, QOps must be installed on the same server as the runner. This makes it possible to include QOps teams in the integration and deployment pipeline of Qlik applications.

Benefits of using QOps

An example of using QOps in the integration and deployment pipeline of a complex Qlik application

The following pipeline is integrated to automate the processes of supporting and updating complex Qlik application of one of company’s clients using GitHub Actions.

Qlik application has a 4-layer structure (transformers – model – dashboard – extractors) and is made in QlikView architecture.

The pipeline is built in such a way that the stages of its execution are determined by the name of Git repository branch. All changes are tracked there.

Below are the active steps that will be executed if a branch named UAT-* is used. The task of this approach is to prepare the necessary files in a separate folder for the trial deployment of a new task when creating a new branch.

After confirming task completion current development is merged with the main repository branch and execution of all process stages is initialized. At the same time, the pipeline uses the logic of selecting only those application files that have been changed. These files are transferred to a given environment, for example, to production.

Development process of the pipeline greatly simplifies runner functionality in the form of using matrix operations on a list of same type applications. This approach is convenient to process transformers that have a similar structure and purpose.

This is how the result of executing successive pipeline steps within one stage looks like. Some steps depending on the conditions set can also be skipped, ignored, or stopped if errors are found.

In case of a runtime error, the pipeline will signal it as follows.

For a more detailed study of each execution step, console output is available at each stage. This makes it convenient to track and resolve errors that occur.

So, CI/CD introduction into Qlik application development and maintenance process has reduced the time spent on converging the results of parallel development and greatly simplified the process of preparing application files for further deployment.

More information about QOps at the link

The right data visualization for an efficient workflow

It’s possible to get a complete picture of current business situation using data visualization. This is especially useful when there are complex datasets and unrelated information. At the moment, there are many types of data visualization. A large number of data visualization options (arc, tagged, waterfall, violin, etc.) provide many ways to analyze data, share information, and discover new ideas. However, each information requires a certain way of visualization in order to effectively present data and meet information needs. For example,

Slope Chart

This chart shows the change between 2 points. It is effective when there are 2 time periods or comparison points and it is necessary to show an increase or decrease in different categories between 2 data points. This type of chart is suitable for visualizing changes in sales, costs, profits in order to obtain information about which indicators increased, which decreased, and how quickly this happened.

Calendar Heat Map

Heatmaps show the changes in a data set over specific periods (months, years). The data is superimposed on the calendar, relative values ​​are displayed in color over time. This option is suitable for visualizing quantity changes depending on the day of the week, how it changes over time (retail purchases, network activity, etc.).

Marimekko Chart

A diagram is used to show the relationship of parts to a whole. It compares groups and measures the influence of categories within each group. It is commonly used in finance, sales and marketing.

With Qlik, it’s possible to create any visualization that will be most effective for achieving a goal. Interactive charts, tables, and objects give an ability to explore and analyze data in depth, that helps to generate new ideas and make the right decisions.

DataLabs is a Qlik Certified Partner. A high level of team competence and an individual approach allows to find a solution in any situation. You can get additional information by filling out the form at the link

Data Governance to improve data quality and security

The key to effective work and data analytics is data quality and security. Decisions quality  and actions efficiency directly depends on data quality used to make them. This, in turn, affects the efficiency of the business as a whole. Poor quality, incomplete and inaccurate data undermine the entire business chain and prevent from achieving the desired results. In this case, user doesn’t have a complete understanding of a current business state, makes wrong decisions and develops a strategy that will not only be ineffective, but may also lead to losses. If there is no trust in the data, nothing else matters, even with a good information system.

It’s possible to provide full control over data assets using Data Governance and Data Integration. These are processes that include tracking, maintaining and protecting data at every stage of the data life cycle.

Data Governance is processes, policies, and tools implementation to manage data security, quality, usability, and availability throughout its lifecycle.

All data management processes should be automated to prevent errors and inaccuracies that occur during manual processing. With automation, it is possible to implement rules and policies to manage data discovery and operational quality improvement. The managed data catalog allows documentation and control of each data asset, definition and control of each user rights. Through profiling, cataloging and access control, user gets the access they need to well-structured datasets and accurate information at the right time.

Data Integration is a platform that automates the entire data pipeline, from ingesting raw data to publishing analytics-ready datasets. Deduplication, standardization, filtering, validation etc provide clean data delivery. The platform includes a data catalog with robust content for data analysis and exploration.

DataLabs is a Qlik Certified Partner. A high level of team competence and an individual approach allows to find a solution in any situation. You can get additional information by filling out the form at the link

Qlik vs Power BI

Let’s continue the comparison of leaders in BI and data integration. Below is a comparison of Qlik and Power BI 12 key features.

  1. Interactive dashboard
  1. Data visualization
  1. Deployment flexibility
  1. Total cost of ownership (TCO)
  1. Scalability
  1. Self-service
  1. Data integration
  1. AI-based analytics
  1. Advanced analytics
  1. Use cases
  1. Mobile business intelligence
  1. Information literacy support

DataLabs is a Qlik Certified Partner. A high level of team competence and an individual approach allows to find a solution in any situation. You can get additional information by filling out the form at the link

Qlik vs Tableau

Qlik, Power BI and Tableau are leaders in BI and data integration according to Gartner report. Each tool has many benefits. However, in order to make the right choice, it is necessary to clearly understand business needs, its tasks and goals, as well as a potential value of BI introducing into different departments workflows, etc. By understanding the business needs and knowing the capabilities of each tool, it is easier to make the right choice.

Comparison of 12 key factors of Qlik and Tableau

  1. Data visualization – data visualization using interactive charts, graphs and maps. This allows to study data in detail in any direction, identify relationships, etc.
  1. Interactive dashboard – the ability to create dashboards for more convenient and free data study.
  1. Total cost of ownership (TCO) – accounting for all costs associated with BI solutions usage for 3-5 years (infrastructure, system configuration, application development, system administration and support).
  1. AI-driven analytics – new insights and connections discovering, quickly data analyzing, team productivity increasing, informed decisions based on data.
  1. Different use cases (on the same platform) – many use cases for BI, working with the same data and platform.
  1. Managed self-service – data and content control with centralized rule-based management and unlimited user power.
  1. Mobile business intelligence – the ability to explore and analyze data from any location.
  1. Scalability – complete and up-to-date presentation of data, processing it at any scale without affecting performance and increasing costs, data integrating and combining from different sources.
  1. Embedded analytics – the presence of full analytical capabilities in other processes, applications and portals in the company for effective decision-making by employees, partners, customers, suppliers etc.
  1. Data integration – combining and transforming raw data into data ready for analysis. Modern tools allow to make data available to the entire company using real-time integration technologies (data capture, streaming data pipeline).
  1. Flexible deployment – an independent multi-cloud architecture that will allow deployment in any environment.
  1. Data literacy – improving the information literacy of employees at all levels, the ability to work with data and make decisions based on them.

Efficient Data Management with Data Fabric

Modern companies often deal with large and complex data sets from different and possibly unrelated data sources (CRM, IoT, streaming data, marketing automation, finance, etc.). Large companies often have branches in different geographic locations. This can complicate the process of data using or storing (in the cloud, hybrid multicloud, on-premises, etc.). Data Fabric will help to combine data from different sources and repositories, transform and process it for further work. As a result, users get a holistic picture of the current situation, that allows them to explore and analyze data to conduct effective business activities.

Data Fabric is a data integration architecture using metadata assets to unify, integrate, and manage disparate data environments. The main task of Data Fabric is to structure the data environment, and it doesn’t require replacement of existing infrastructure. Metadata and data access are managed by adding an additional technology layer over the existing infrastructure. Standardizing, connecting, and automating of Data Fabric data management practices improves data security and availability, enables end-to-end integration of data pipelines and on-premises cloud, hybrid multicloud, and edge device platforms.

Benefits of Data Fabric using:

Data Fabric simplifies a distributed data environment where they it can be received, transformed, managed, stored. It also defines access for multiple repositories and use cases (BI tools, operational applications. This is made possible by continuous metadata analytics to build the web layer. It integrates data processing processes and many sources, types, and locations of data.

Differences Data Fabric from the standard data integration ecosystem:

The Data Fabric architecture depends on individual data needs and queries of business. However, there are 6 main levels:

  1. Data management (ensuring management and security processes);
  2. Receiving data (determining the relationship between structured and unstructured data);
  3. Data processing (only relevant data extraction);
  4. Data orchestration (data cleansing, transformation and integration);
  5. Data discovery (identifying new ways to integrate different data sources);
  6. Access to data (the ability of users to explore data using BI tools).

 When implementing Data Fabric, you need to consider:

DataLabs is a Qlik Certified Partner. A high level of team competence and an individual approach allows to find a solution in any situation. You can get additional information by filling out the form at the link

Visual analytics – definition and benefits

Currently, one of the most promising and rapidly developing areas is visual analytics. Its advantage lies in the ability to work with large datasets, combining graphical visualization and powerful analytical calculations.

Visual analytics is the process of using sophisticated tools and methods to analyze data using visual data representations in the form of graphs, charts, and maps. This allows users identify patterns and insights that help them make better data-driven decisions.

Visual analytics is not just a graphic data representation and should not be confused with data visualization. State-of-the-art interactive visual analytics makes it easy to combine data from multiple sources and in-depth data analysis right in the visualization. The use of artificial intelligence and machine learning algorithms generate recommendations for a more detailed data study. The main task of this tool is to turn large data amounts into successful business ideas.

Visual analytics advantages:

Key recommendations for the qualitative use of visual analytics:

The large number of vendors that offer visualization features as part of the software makes it difficult to choose the right tool.

Modern data analysis tools include the following features:

DataLabs is a Qlik Certified Partner. A high level of team competence and an individual approach allows to find a solution in any situation. You can get additional information by filling out the form at the link

More possibilities with Qlik AutoML

Machine learning applications have reached ubiquity (from solving health problems to choosing music or products). Business is also an active user of machine learning tools.

Today, companies, including, which are interested in expanding the capabilities of their teams and specialists who know how to work with data. For example, a BI engineer who participates in the analytics process could develop features, train, automatically select a reliable model and help deploy it without the involvement of data scientists and machine learning. Qlik AutoML helps companies maximize their data and analytics strategy.

Qlik AutoML is an automated machine learning platform designed for analysts to create models, forecasts, and conduct business scenario testing. A simple, no-code user interface makes it easy to work with data by identifying its key drivers, make predictions with a full data understanding, publish and integrate models into Qlik Sense dashboards for interactive analysis.

This tool identifies key drivers of historical data and builds machine learning models using the best algorithms. Qlik AutoML allows to:

Using Qlik AutoML:

DataLabs is a Qlik Certified Partner. A high level of team competence and an individual approach allows to find a solution in any situation. You can get additional information by filling out the form at the link

GoUp Chat