
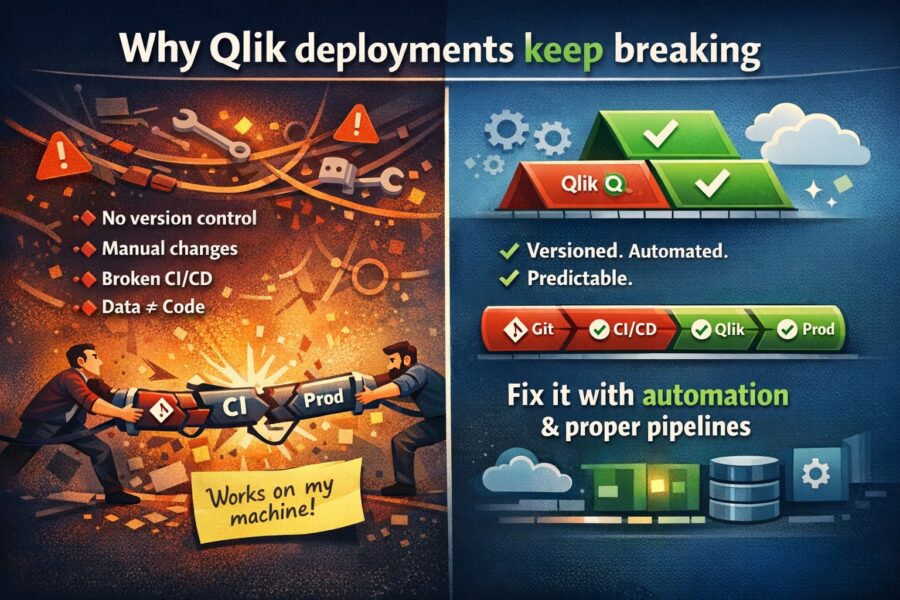
Why Your Qlik Deployments Keep Breaking
Every Qlik team has a deployment horror story. Maybe it was the app launch load script bug that decided to release an app to production with a broken ...

Increasingly С-suit leadership has BI implementing in work process on his mind. It is fairly, since a possibility to get additional information and data appears with help of such tool. However, without proper analyzing and understanding received data has the form of numbers set. Key goal is to form correct conclusions generation on the basis of which will be made best performing decisions.
It’s worth to remark that there is no one right way to analyze data. Above all it’s necessary to understand which data type you need to work with, and which goals have to be achieved. Based on this, methods of analysis could be changed and each of them will be effective in some cases.
Nevertheless, there are some basis and more effective techniques and most of data analytics software include them. Let’s describe 5 main techniques.
Quantitative and qualitative data
One of the most important element when making a selection of technique is a data type understanding (it could be quantitative or qualitative).
In the first instance – it is accurately measured and counted information like sales volume, click number and desired actions, profit, costs and other rates that could be transformed to exact number.
In the latter case – it’s just subjective information that was received resulting from different interviews with employees, customers or independent people. It allows to evaluate more qualitative aspects. By this technique will be received less transparent data than by quantitative.
Quantitative data measuring
1. Regression analysis – is a perfect tool for predicted data and future tendency calculation. This technique allows to specify connection between dependent variable and independent variable. Regression analysis helps to identify and understand relation between different factors in consequence of which it’s possible to optimize internal processes.
2. T-testing – is indispensable tool for current hypothesis checking, or rather to compare current data with hypothesis and assumptions. Such technique gives a possibility to forecast various courses of actions influence over enterprise performance. Also, it helps to find correlation dependence between variables and make decisions in the round of results.
3. Monte Carlo simulation – is one of the most popular and useful tools for evaluation of unpredictable variables influence over specific factor by way of random numbers and data simulation. This technique has common usage in different directions (project management, finance, logistics, engineering).
Qualitative data measuring
4. Content analysis – has a form of analyzing technique that allows to understand topics of qualitative data. Also, it’s possible to identify commonest topics by the use of specific themes and ideas color-coding. The method is often used to analyze customer reviews, interview and surveys. As a consequence of this it’s easy to specify pain points.
5. Narrative analysis – helps to understand better organization culture by people stories analyzing. In this way it is possible to determinate an employees’ attitude to work and customers’ attitude to organization.
There is no «golden standard» of data analysis. The main condition of proper analyzing: the methodology has to reflect basic data and information type that needed to be obtained as a result.
Every Qlik team has a deployment horror story. Maybe it was the app launch load script bug that decided to release an app to production with a broken ...
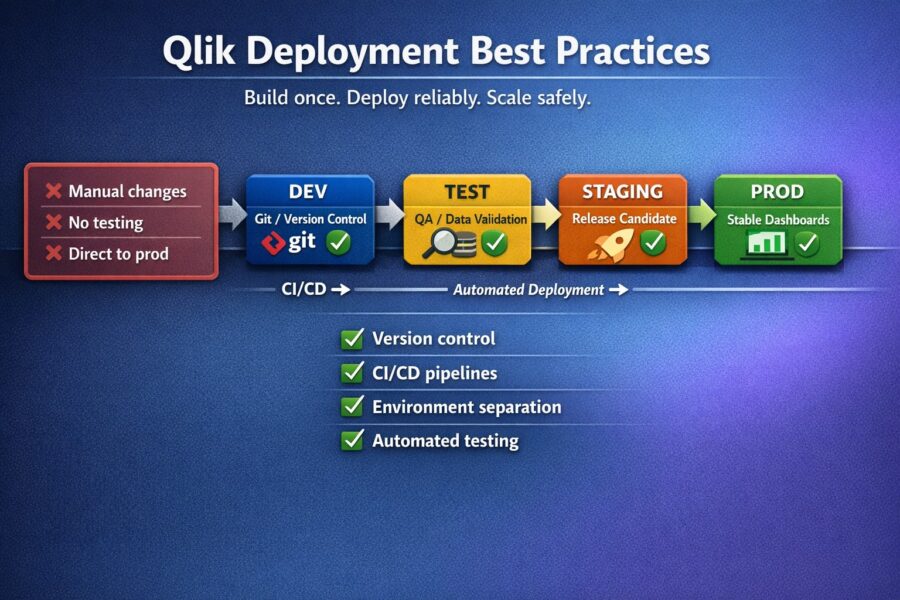
Are you the type of person who deploys Qlik apps by simply exporting a QVF, renaming it, and then importing it to your target environment? If so you&#...

During a briefing on the Iraq War, Donald Rumsfeld divided information into 4 categories: known known, known unknown, unknown known, unknown unknown. ...
No comments yet.
Leave a comment