Sixteen years ago I got my first big BI project. The task sounded simple: build the analytics for an inventory system based on drum-buffer-rope, Goldratt’s Theory of Constraints applied to stock. I was young enough to think the hard part would be the SQL.
The hard part was everything else. Along the road they even had to change the Head of procurement. And the lessons from that project still run my thinking about inventory analytics today, because most of what I have seen since is dashboards that show you what you already lost. Stockouts you did not prevent. Weeks of working capital sleeping in overstock. A beautiful report about yesterday’s damage.
DBR, applied to inventory with a proper analytics layer underneath, does something different: it turns reporting into an operating system for ordering decisions.
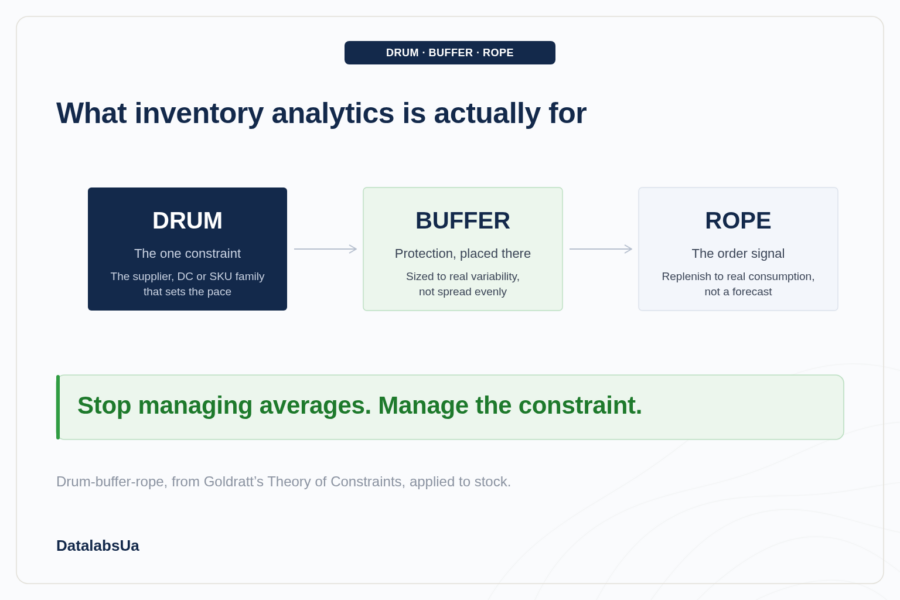
Goldratt’s model says every flow has one constraint that sets the pace for everything else. That constraint is the drum. The whole system marches to its beat whether you admit it or not.
The buffer is protection. Time or stock placed exactly where it keeps the constraint from starving. Not everywhere. Exactly there.
The rope is the signal that ties the rest of the system to the drum. Nobody upstream is allowed to produce or order more than the constraint can swallow. The rope keeps the flow honest.
In manufacturing this is about machines and work centers. In inventory management the translation is direct:
The shift sounds simple and it is brutal in practice: stop managing averages, start managing the constraint.
Here is the uncomfortable part for my own profession. You cannot reliably identify the drum from BI alone.
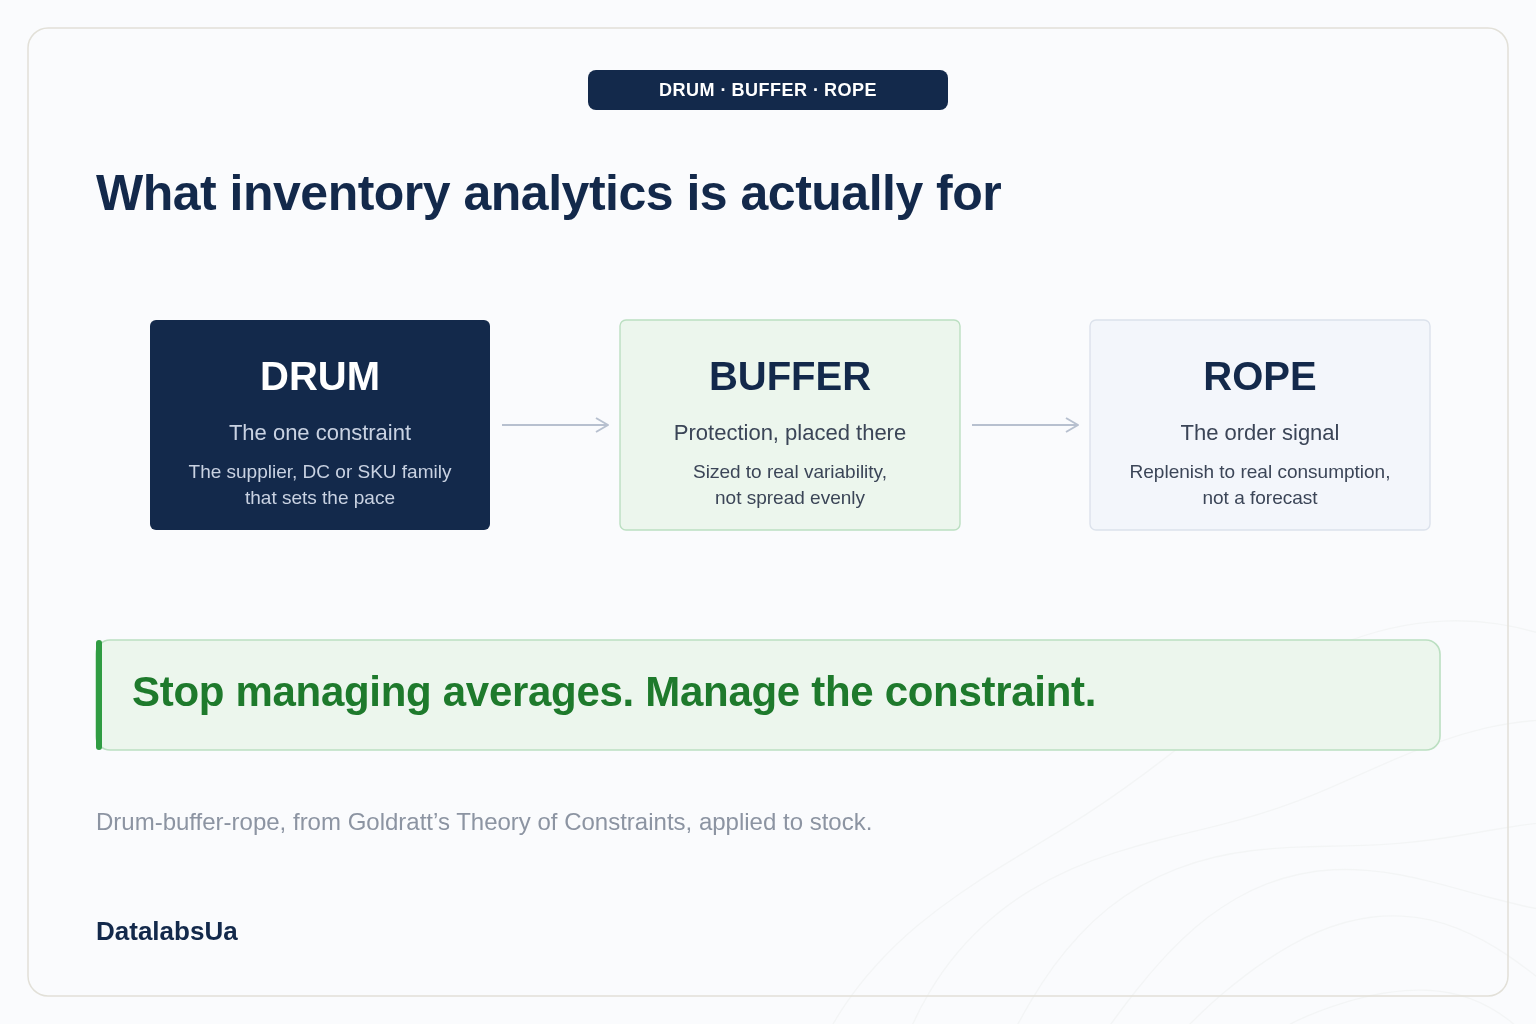
The data will happily mislead you. A supplier’s lead time in the ERP says 14 days because that is what the contract says. Procurement knows the real number is 25 in season and 40 when a certain factory in a certain region takes holidays. An item shows healthy average stock while it silently oscillates between overstock and stockout, and the average hides both. A warehouse looks fine in aggregate while one picking zone throttles every order that matters.
BI sees the whole flow and knows where the numbers thin out. Procurement lives with suppliers and knows which lead time is real and which is a contract fantasy. The drum only becomes visible where those two kinds of knowledge sit at one table.
This is the point I want every BI team lead and every head of procurement to hear: the precision of an inventory decision is not a property of the model. It is a property of the collaboration. The best DBR analytics I have seen were built in working sessions where a procurement manager kept saying “that number is wrong, and here is why” and the BI developer kept encoding those corrections into the logic. After a dozen rounds the model stopped being a report and became a shared brain.
And the same joint view is what catches problems early. A buffer burning down is visible in the data days before it becomes a firefight. But only if the person watching understands both what the number says and what the supplier behind it is doing. Analytics gives you the early signal. Domain knowledge tells you whether it is noise or the start of a fire.
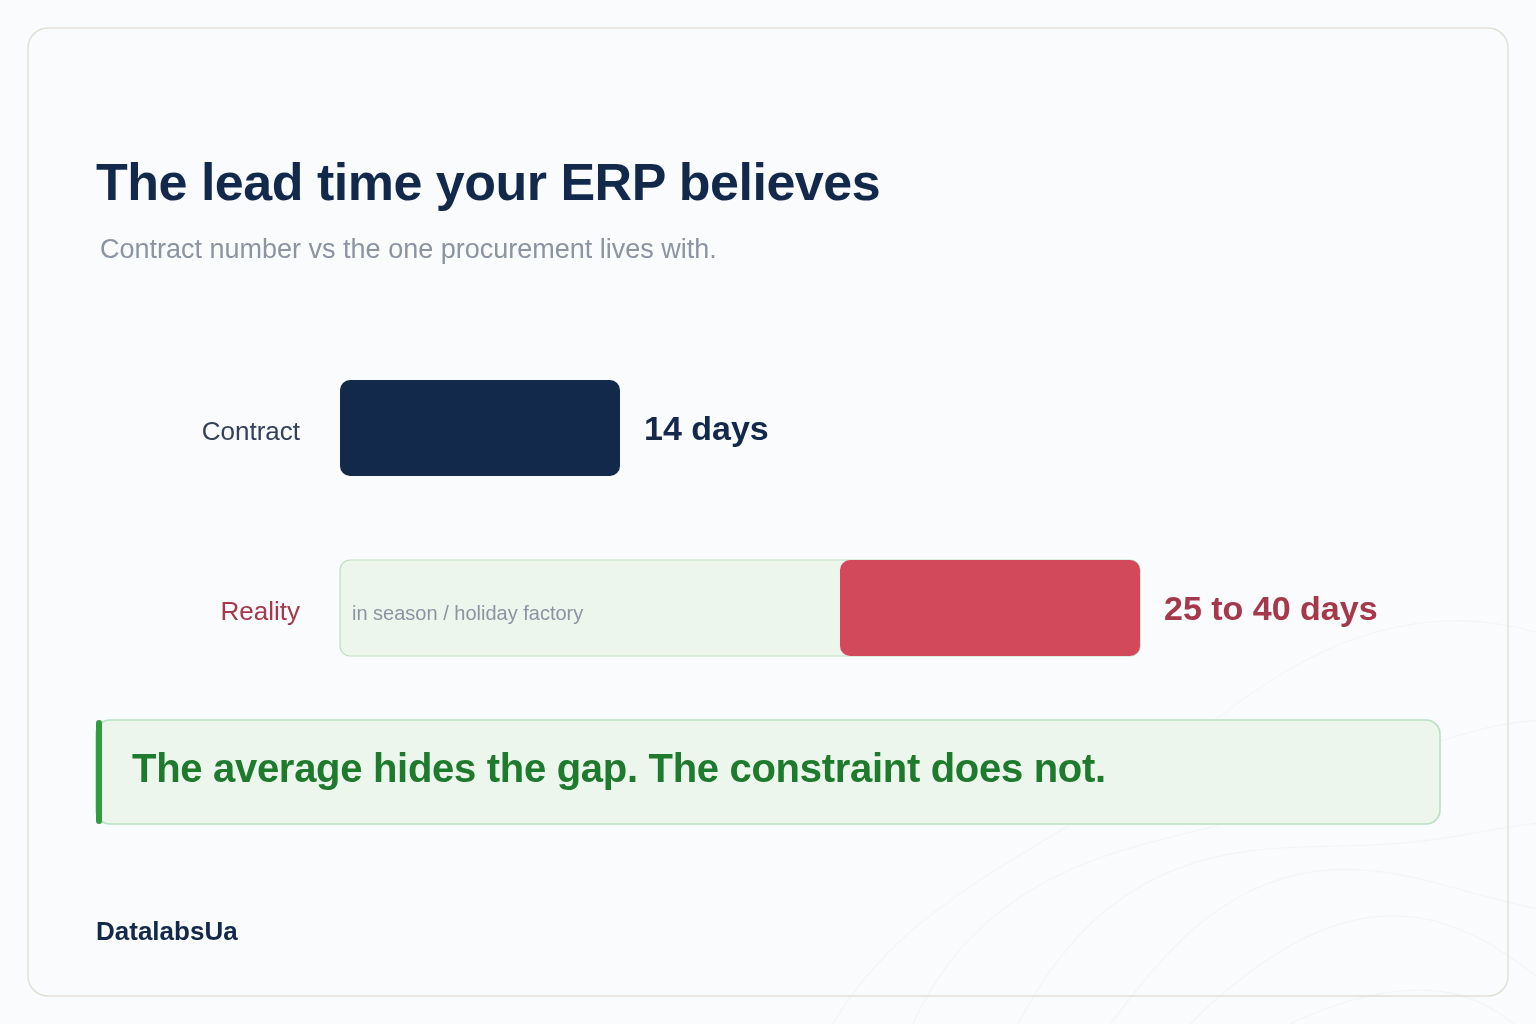
Once the drum is identified and buffers are sized, the day-to-day becomes surprisingly calm. Every buffer lives in three zones. Green: do nothing. Yellow: attention, prepare the order. Red: act now, the constraint is in danger.
This is where analytics earns its keep. Zone penetration is computable in near real time. Trend of penetration is computable. “This buffer will go red in nine days at current consumption” is computable. None of this requires machine learning heroics. It requires clean flow data, honest lead times, and logic both sides trust.
The rhythm looks like this: analytics watches the buffers, flags the yellows and reds with their reasons, procurement confirms or corrects against supplier reality, orders follow the rope. Every exception becomes a small lesson encoded back into the buffer logic. The system gets smarter every month, and the monthly all-hands panic about stockouts quietly disappears from the calendar.
When the buffers are honest and the signals are trusted, the next step stops being scary: let the system draft the orders.
Not “AI decides and nobody knows why”. The analytics computes order proposals from buffer penetration, real consumption, and real lead times. A human, usually in procurement, reviews the draft, adjusts the few lines where reality outran the data, and approves. Over time the share of untouched lines grows. The business stops hiccuping on stockouts and stops burying capital in just-in-case stock, because the ordering decision now lives in the data and the human attention goes only where the data says it should.
That is what business continuity actually looks like in inventory: not a heroic manager who remembers everything, but a boring, reliable loop of signal, review, order.
There is one requirement under all of this, and it is the one most companies trip over.
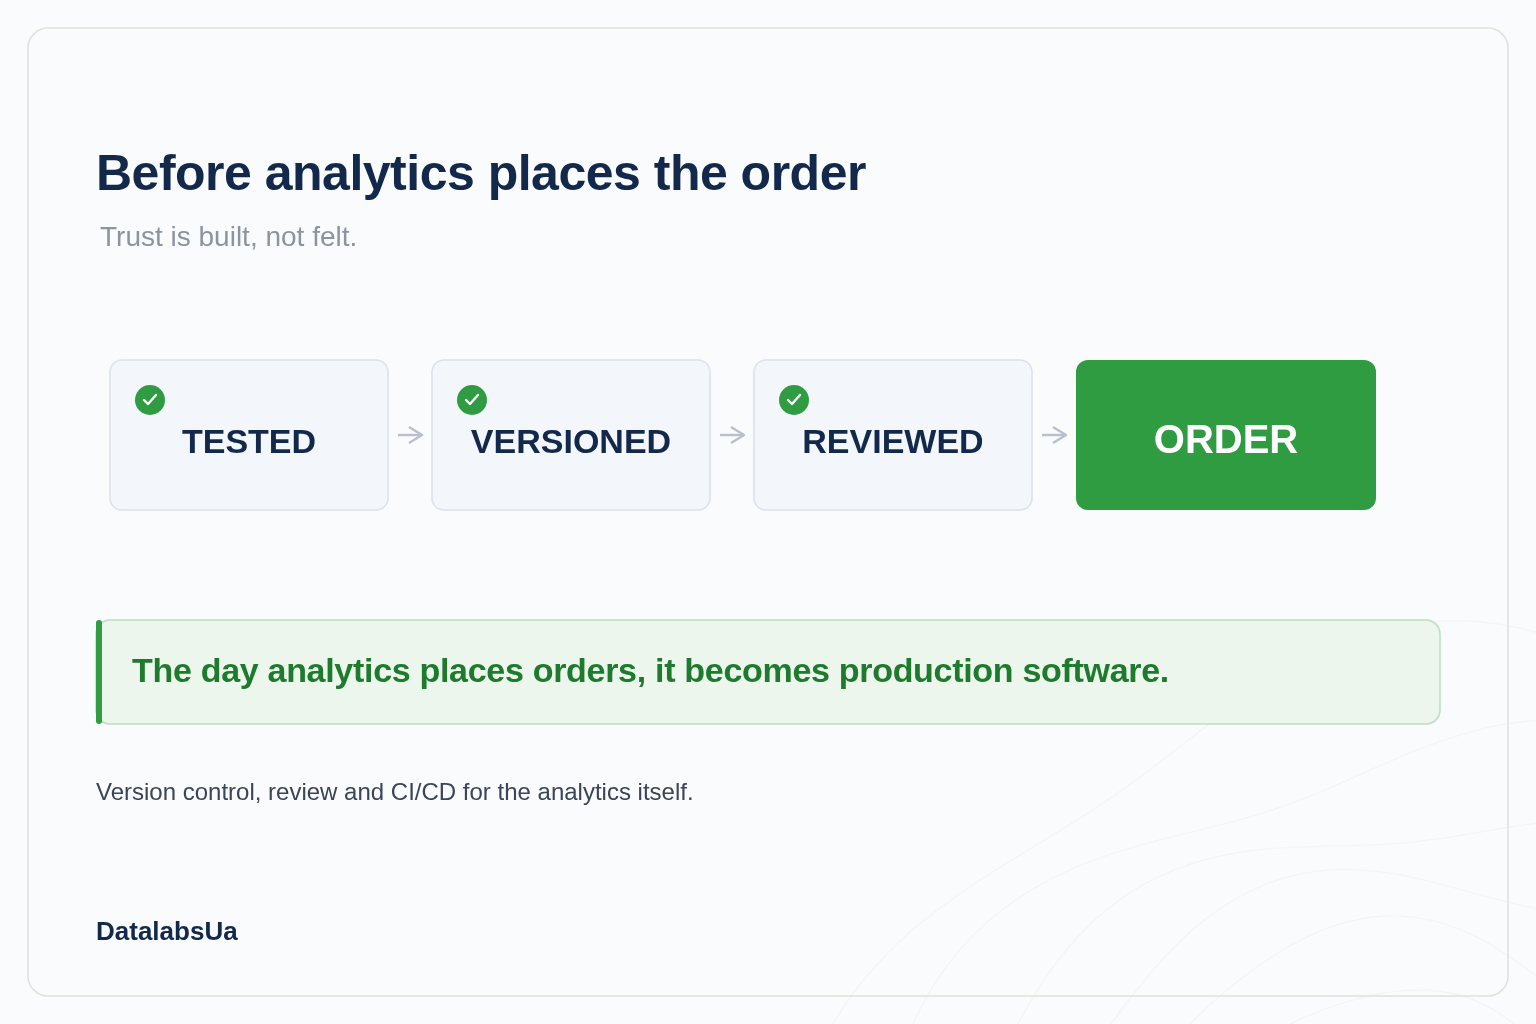
You only hand the ordering button to analytics you trust. And trust is not a feeling, it is a property you build. The transformations behind the buffer logic have to be tested, because one silent join error means a warehouse full of the wrong goods. The logic has to be versioned, because “who changed the buffer formula and when” is an audit question, not a curiosity. Changes have to be reviewed, because the person who edits the lead time logic should not be the only person who ever saw it.
Getting analytics to that level of trust is a discipline question, not a tooling one. Data teams in warehousing learned this years ago and called it analytics engineering. BI teams that want their conclusions wired into real ordering decisions are now learning the same lesson.
That discipline is a topic for its own article. The short version: treat the analytics behind operational decisions with the same engineering seriousness as the decisions deserve.
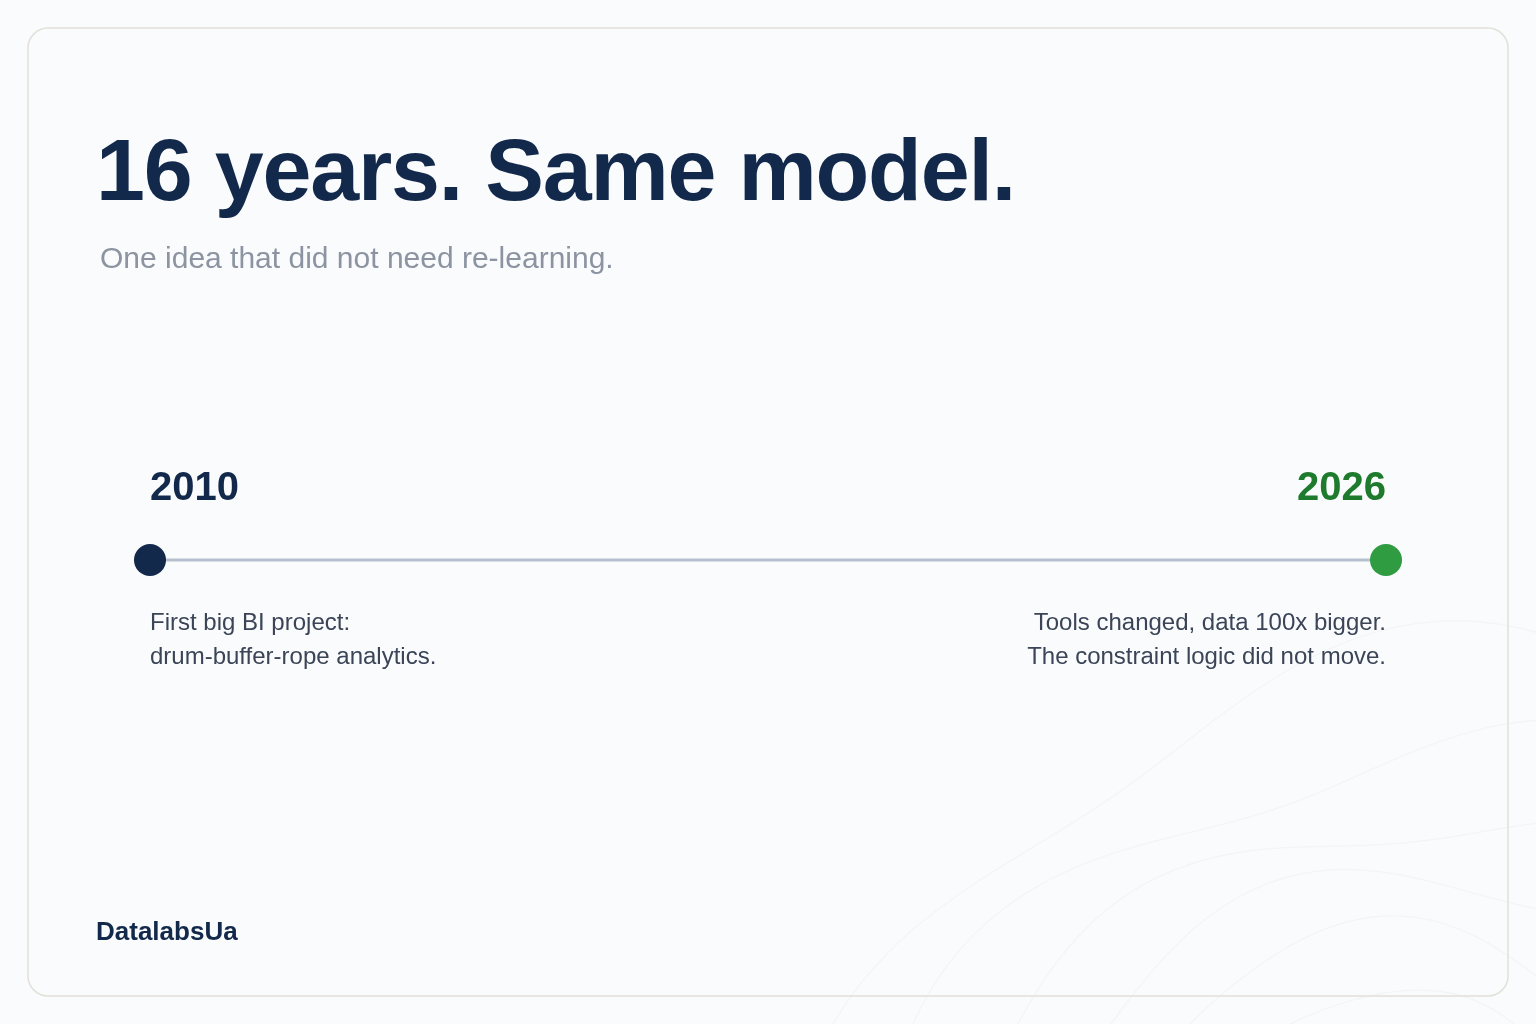
Sixteen years after that first project, the model still holds. Suppliers changed, tools changed, the data got a hundred times bigger. The constraint logic did not move an inch.
So be honest about it: is your ordering decision in the data, in a monthly Excel ritual, or in somebody’s gut plus heroics? If the answer is “gut plus heroics”, drum-buffer-rope gives you a concrete first step. Find your drum. One constraint. This week. With BI and procurement in one room.



No comments yet.
Leave a comment