#fridaypost

Frequently asked questions about QOps

In September 2022, we introduced our own product QOps. DataLabs team fully accompanies the client during the installation and use of the product and offers 24/7 support. We regularly receive feedback regarding QOps usage, that allows us to look at our own product through the user’s eyes. Below we have prepared answers to the most common questions:

  1. Are triggers and additional properties saved for Qlik apps?

Yes. However, it is worth considering that some properties require a minimal data model to be maintained in the application. To do this, QlikView provides a «reduce» mode.

For Qlik Sense apps, an additional «always one selected» field is retained. To do this, it is necessary to save selections additionally, since this is a bit at odds with the concept of QOps to save only the source code and properties.

  1. Is it possible to merge the visual part in Qlik Sense?

The situation when several developers work on the same sheet, and everyone does own part of the work is possible with QOps. For its implementation it is necessary to adhere to a competent branch strategy to avoid merge conflicts. It is also worth paying attention to the correct resolution of merge conflicts in case occur to not disrupt interaction with the Qlik API.

  1. Is it possible to work with Bitbucket and Jenkins?

Yes, it is possible. Source codes for a Qlik application can be hosted in a Bitbucket repository, and with the help of CI/CD web-hooks, a process can be built on top of Jenkins.

  1. How does QOps differ from analogues and what are the advantages of using it?

QOps is primarily focused on the implementation of interaction with Qlik API and CI/CD implementation. Thus, QOps makes available in the console all the commands necessary to work with Qlik applications and ensures the integrity of applications when using additional code in variables or extensions.

The work of analogs is carried out only in the browser. It is also worth noting that they currently don’t support CI/CD across Git-based version control hosting systems and direct user interaction with the source code.

  1. Is it possible to use QOps to protect code in Qlik applications?

Yes, it’s possible. QOps allows users to save and manage changes to source code.

  1. Is it possible to migrate source code of a QlikView application to Qlik Sense using QOps?

No. But it is possible to manage the source code of both QlikView and Qlik Sense with QOps.

  1. What is QOps architecture and what is required for installation?

QOps is installed using the installer. We provide step by step instructions for installing and using the product. You can find the documentation at qops.datalabsua.com

If you encounter difficulties during the installation process, you can contact QOps support for a prompt solution to the problem.

  1. Is there a trial period for using QOps?

Email us [email protected] or fill out the form at qops.datalabsua.com

  1. Model and conditions for purchasing QOps

The purchase model is a pack of 10 licenses. CI/CD implementation requires an additional license for each runner where QOps will be used. Additionally, a Qlik license is required. Detailed information can be found by filling out the form on QOps website.

Each client is special and has unique needs. If you have any questions, we will be happy to answer them:
[email protected]

+1 716 226 8951

+359 87 741 65 41

+44 2392 16 0664

+380 98 004 88 80

Risks of QOps misuse

Each product is accompanied by instructions that clearly indicate the rules of use, warnings and risks that may arise in case of improper use. It’s fair to talk about some of misusing QOps risks.

QOps opens the way for developers to directly modify the Qlik source code.

The source codes for Qlik Sense applications are built using JSON objects. JSON (JavaScript Object Notation) is a text-based structured data interchange format based on JavaScript. This format can also be used in any programming language.

This structure of the application source code in Qlik Sense reduces the risk of damage, which is due to the developer’s ability to revise JSON files and make changes to their structure. However, risks still exist:

  1. The occurrence of conflicts when changing the same lines of code in different branches of the repository. For example, the page size may not match the placement coordinates of the object. The result is a critical API error that prevents QOps from building the application.
  2. Blocking the application as a result of merging changes. For example, the user makes changes that are not supported by Qlik’s internal API.

QlikView code is built on xml objects and xml data. Incorrect use of QOps (for example, violation of checksum integrity, violation of changes logic in features inside xml files) can lead to incorrect operation of the application or a complete stop of work.

This can be avoided by using the correct branching strategy (read more about the branching strategy here), as well as avoiding merge conflicts. The solution of such conflicts involves time planning and the presence of a specialist who coordinates all changes and directly manages this process.

It is also worth noting that the developer and user may not know for sure how Qlik will perceive a particular piece of code. However, a good approach to the development process, avoiding new objects or adding new objects in accordance with Qlik API will help to avoid errors.

To solve any problems and nuances that may arise in the process of using QOps, there is a 24/7 support service. A team of specialists quickly identifies errors and finds a solution.

More information here

QOps place in secure data access ensuring

In the modern world, data is the most valuable resource that opens new opportunities for development, new ideas and efficient operations. Its value creates high cybercriminals’ interest who steal or corrupt data for their own benefit. Their methods are becoming more sophisticated and inconspicuous, and the consequences become more serious, that incur large financial and reputational losses. The issue of data security is of key importance and is not bypassed by standard security programs.

Data security is a technology set for protecting data from intentional and accidental destruction, alteration and disclosure of data. Most data threats are external, however, don’t neglect the internal data protection system.

Data protection methods include:

Many companies outsource some of their work. It’s a common and convenient practice. But  it requires a serious approach to ensuring data security. Companies that care about their customers and data integrity will not give any partner free access to data. Sensitive data (customer information, banking information, confidential information, etc.) needs special protection. The design and implementation of any BI solution must take this into account.

When developing QOps, data security requirements were considered. Data protection and validation is ensured in QOps by:

GitHub, GitLab, Bitbucket hosting systems provide the ability to set up a private or public repository. A private repository implies access to certain users (team members, administrator, etc.). In the situation with public repository everyone has access. Often in hosting systems, public repositories are provided through a subscription. A private repository with corresponding keys assumes a paid basis.

In closed systems, in order to increase data security, separate servers are also allocated for public and confidential data (customer data, phone numbers, email, etc.). Access to such data is severely limited. To protect personal data in Europe, there is a regulation (GDPR), that determines the rules and procedures for such data processing by companies and organizations. Any company that provides a service or sells a product to citizens of the European Union must comply with these requirements.

To comply with GDPR rules and ensure data protection when QOps works with secure Qlik servers, it is possible to connect through QOps Proxy. Thus, the certificate required to connect to the Qlik Server API is located on the same confidential server and does not go beyond it. This prevents the risks of third-party users connecting, taking possession of the certificate and password, as well as gaining access to data in the future. A special authentication method using AzureAD allows to connect the authorized user’s work machine to the QOps Proxy. In turn, the latter, using a certificate, connects to the server and sends only the data and source code to which the user has access.

The complete architecture of the interaction between QOps installed on the user’s local computer and QOps installed in the server environment is as follows. As you can see, this complies with data security requirements and provides flexibility in managing the source codes of Qlik applications using a git-repository, git-runners and a convenient development environment and source code editor VS Code.

More information you will find on QOps website

Tracking system integration with git repository

Developer’s workflow consists of many different tasks and projects. Tracking systems are used to structure them and organize convenient work. Small projects use Excel spreadsheets quite successfully for this purpose. However, project development requires more convenient solution implementation.

A tracking system is a software product, project management system that ensures the fulfillment of tasks, workflow planning, monitoring processes and results. This tool is useful for all team members: developers, project managers, team leads, top management, etc.

Now, the market offers large number of options for tracking systems: Jira, Mantis, Trello, Redmine, PivotalTracker, Bugzilla, Commind, etc. One of the most popular solutions is Jira.

Jira is a comprehensive solution from the Australian company Atlassian, which includes Jira WM (for working with business processes), Jira SM (for service disk building), Jira Software (for software development projects). These products are grouped into the Jira Family Product.

This tool is a paid system with an interactive dashboard for monitoring tasks movement and controlling their progress in a specific project. It is also a bug tracking and a convenient tool for project management, especially for agile teams. The main Jira goal is to simplify workflow management. The system has a wide functionality with the ability to supplement it with the help of plugins. There is a trial version of this tool for 7 days, which is available on the developer’s official website after user registration.

Jira benefits:

It is worth noting the rather long tool setting process for a specific project, workflows and a complex interface. The reason for this is the wide functionality of the system. However, tool study and practice allow to fine-tune it and optimize it during use.

Jira features depending on teams, roles and purposes of use:

The ability to integrate a tracking system and host a remote git repository is very convenient in managing Qlik projects. QOps can be used as a bridge between the source code in a repository and the final application. This kind of integration allows to automatically embed links to tasks in the tracking system into the source code of the application. As well as this feature allows management to track the progress of tickets and the corresponding source code migration between environments and/or versions.

More information at the link

DevOps approaches to process a large number of tests and application

CI/CD pipelines help to minimize potential risks in the process of integrating code changes into the repository, isolate the impact of possible errors and simplify fixing process. The main CI/CD goal is to speed up development process and value delivery to the end user. However, there are always ways and tools to make the process even more efficient. The matrix approach is one such option.

The basic pipeline structure involves the execution of tasks simultaneously at a certain stage. Tasks at the next stage can be completed if the previous ones are completed. This process continues at all stages. Different tasks in a pipeline take different times to complete. So, team members must wait to make their changes to the project. This significantly slows down the workflow and reduces productivity. Also, the presence of the same pipelines and creation scripts can lead to pipelines blocking. To optimize resources and increase productivity, it makes sense to create tasks clones and run them in parallel.

Previously, it was necessary to manually define tasks for their parallel execution. With the advent of parallel matrix jobs, it became possible to create jobs at runtime based on specified variables.

The matrix strategy uses variables when defining a job and allows to provide automatic creation of multiple job executions. This strategy can be used in the process of testing code in different languages and/or different operating systems. The matrix can be created with different job configurations specifying one or more variables. By defining variables (one or more), task will be applied for each variable combination.

It is also worth considering one feature. So, organizations often use mono-repositories for better project management. However, pipeline performance is degraded when there are many projects in the repository and one pipeline definition is used to run different automated processes for different components. Using parent and child pipelines makes pipelines more efficient. This approach minimizes the chance of merge conflicts and allows editing of pipeline parts if necessary.

On the one hand, pipelines optimization reduces the time developers spend on maintenance. On the other hand, it frees up time and space for new ideas, creativity and increased productivity. For example, using a matrix, it is possible to break down large pipelines into manageable parts for more efficient maintenance and maximization of tasks amount that run in parallel. The order in which jobs are created dictates the order of the variables in the matrix. The first variable is the first job in the run.

The complex Qlik application architecture consists of several layers (transformers, model, dashboard and extractors). And when using QOps, the matrix strategy is the best suited for managing applications of the same type within the same layer. These include applications in the layer of transformers and extractors.

GitHub, GitLab and Jenkins allow to build pipelines based on a matrix strategy that iterates over the available tasks according to cartesian multiplication. This was done to expand CI/CD capabilities, namely in testing on different platforms or, for example, with different frameworks versions.

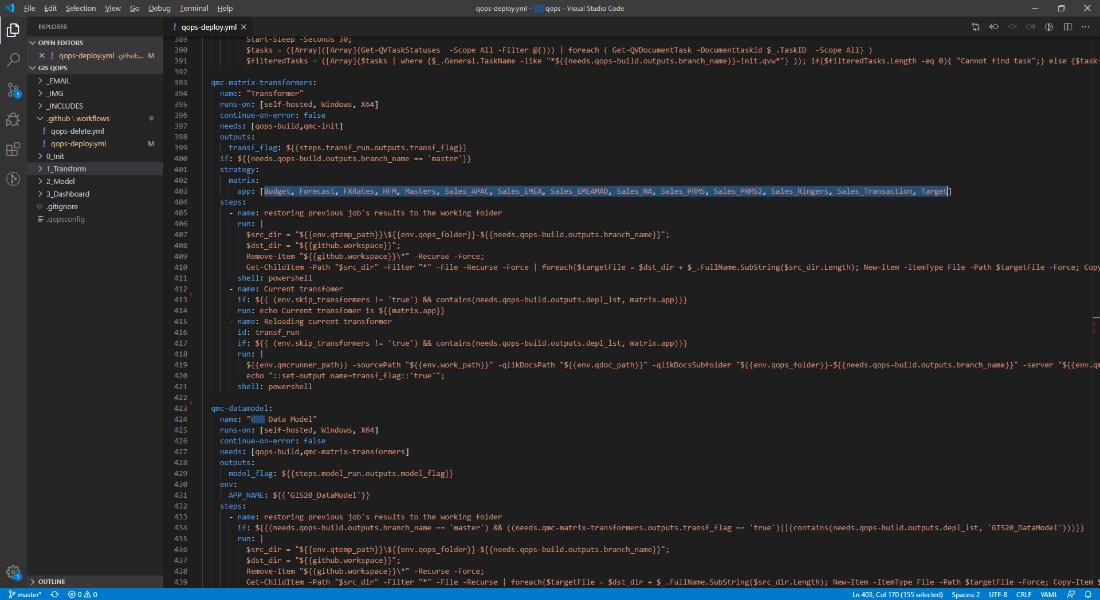
The screenshot below contains an example pipeline source file for GitHub, where transformer overloading is implemented using a matrix strategy. The keyword for this is matrix in strategy block. The required list of applications is specified as a list on line 403. In this case, the substitution of the iterated application will be performed each time matrix.app is specified.

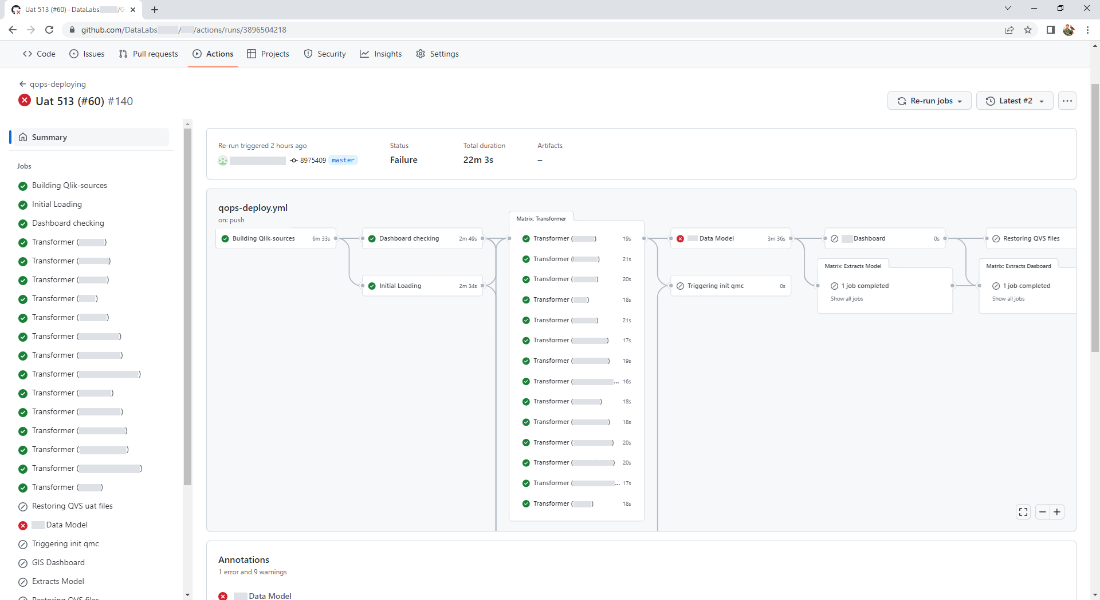
This is how used applications list in GitHub graphical interface looks like when executing the pipeline. At the same time, scaling the number of processed applications is easily performed. To do this, it is enough just to change their list and not make changes to the executable part of the code.

More information you will find at the link

The right data visualization for an efficient workflow

It’s possible to get a complete picture of current business situation using data visualization. This is especially useful when there are complex datasets and unrelated information. At the moment, there are many types of data visualization. A large number of data visualization options (arc, tagged, waterfall, violin, etc.) provide many ways to analyze data, share information, and discover new ideas. However, each information requires a certain way of visualization in order to effectively present data and meet information needs. For example,

Slope Chart

This chart shows the change between 2 points. It is effective when there are 2 time periods or comparison points and it is necessary to show an increase or decrease in different categories between 2 data points. This type of chart is suitable for visualizing changes in sales, costs, profits in order to obtain information about which indicators increased, which decreased, and how quickly this happened.

Calendar Heat Map

Heatmaps show the changes in a data set over specific periods (months, years). The data is superimposed on the calendar, relative values ​​are displayed in color over time. This option is suitable for visualizing quantity changes depending on the day of the week, how it changes over time (retail purchases, network activity, etc.).

Marimekko Chart

A diagram is used to show the relationship of parts to a whole. It compares groups and measures the influence of categories within each group. It is commonly used in finance, sales and marketing.

With Qlik, it’s possible to create any visualization that will be most effective for achieving a goal. Interactive charts, tables, and objects give an ability to explore and analyze data in depth, that helps to generate new ideas and make the right decisions.

DataLabs is a Qlik Certified Partner. A high level of team competence and an individual approach allows to find a solution in any situation. You can get additional information by filling out the form at the link

Data Governance to improve data quality and security

The key to effective work and data analytics is data quality and security. Decisions quality  and actions efficiency directly depends on data quality used to make them. This, in turn, affects the efficiency of the business as a whole. Poor quality, incomplete and inaccurate data undermine the entire business chain and prevent from achieving the desired results. In this case, user doesn’t have a complete understanding of a current business state, makes wrong decisions and develops a strategy that will not only be ineffective, but may also lead to losses. If there is no trust in the data, nothing else matters, even with a good information system.

It’s possible to provide full control over data assets using Data Governance and Data Integration. These are processes that include tracking, maintaining and protecting data at every stage of the data life cycle.

Data Governance is processes, policies, and tools implementation to manage data security, quality, usability, and availability throughout its lifecycle.

All data management processes should be automated to prevent errors and inaccuracies that occur during manual processing. With automation, it is possible to implement rules and policies to manage data discovery and operational quality improvement. The managed data catalog allows documentation and control of each data asset, definition and control of each user rights. Through profiling, cataloging and access control, user gets the access they need to well-structured datasets and accurate information at the right time.

Data Integration is a platform that automates the entire data pipeline, from ingesting raw data to publishing analytics-ready datasets. Deduplication, standardization, filtering, validation etc provide clean data delivery. The platform includes a data catalog with robust content for data analysis and exploration.

DataLabs is a Qlik Certified Partner. A high level of team competence and an individual approach allows to find a solution in any situation. You can get additional information by filling out the form at the link

Qlik vs Power BI

Let’s continue the comparison of leaders in BI and data integration. Below is a comparison of Qlik and Power BI 12 key features.

  1. Interactive dashboard
  1. Data visualization
  1. Deployment flexibility
  1. Total cost of ownership (TCO)
  1. Scalability
  1. Self-service
  1. Data integration
  1. AI-based analytics
  1. Advanced analytics
  1. Use cases
  1. Mobile business intelligence
  1. Information literacy support

DataLabs is a Qlik Certified Partner. A high level of team competence and an individual approach allows to find a solution in any situation. You can get additional information by filling out the form at the link

Qlik vs Tableau

Qlik, Power BI and Tableau are leaders in BI and data integration according to Gartner report. Each tool has many benefits. However, in order to make the right choice, it is necessary to clearly understand business needs, its tasks and goals, as well as a potential value of BI introducing into different departments workflows, etc. By understanding the business needs and knowing the capabilities of each tool, it is easier to make the right choice.

Comparison of 12 key factors of Qlik and Tableau

  1. Data visualization – data visualization using interactive charts, graphs and maps. This allows to study data in detail in any direction, identify relationships, etc.
  1. Interactive dashboard – the ability to create dashboards for more convenient and free data study.
  1. Total cost of ownership (TCO) – accounting for all costs associated with BI solutions usage for 3-5 years (infrastructure, system configuration, application development, system administration and support).
  1. AI-driven analytics – new insights and connections discovering, quickly data analyzing, team productivity increasing, informed decisions based on data.
  1. Different use cases (on the same platform) – many use cases for BI, working with the same data and platform.
  1. Managed self-service – data and content control with centralized rule-based management and unlimited user power.
  1. Mobile business intelligence – the ability to explore and analyze data from any location.
  1. Scalability – complete and up-to-date presentation of data, processing it at any scale without affecting performance and increasing costs, data integrating and combining from different sources.
  1. Embedded analytics – the presence of full analytical capabilities in other processes, applications and portals in the company for effective decision-making by employees, partners, customers, suppliers etc.
  1. Data integration – combining and transforming raw data into data ready for analysis. Modern tools allow to make data available to the entire company using real-time integration technologies (data capture, streaming data pipeline).
  1. Flexible deployment – an independent multi-cloud architecture that will allow deployment in any environment.
  1. Data literacy – improving the information literacy of employees at all levels, the ability to work with data and make decisions based on them.

Efficient Data Management with Data Fabric

Modern companies often deal with large and complex data sets from different and possibly unrelated data sources (CRM, IoT, streaming data, marketing automation, finance, etc.). Large companies often have branches in different geographic locations. This can complicate the process of data using or storing (in the cloud, hybrid multicloud, on-premises, etc.). Data Fabric will help to combine data from different sources and repositories, transform and process it for further work. As a result, users get a holistic picture of the current situation, that allows them to explore and analyze data to conduct effective business activities.

Data Fabric is a data integration architecture using metadata assets to unify, integrate, and manage disparate data environments. The main task of Data Fabric is to structure the data environment, and it doesn’t require replacement of existing infrastructure. Metadata and data access are managed by adding an additional technology layer over the existing infrastructure. Standardizing, connecting, and automating of Data Fabric data management practices improves data security and availability, enables end-to-end integration of data pipelines and on-premises cloud, hybrid multicloud, and edge device platforms.

Benefits of Data Fabric using:

Data Fabric simplifies a distributed data environment where they it can be received, transformed, managed, stored. It also defines access for multiple repositories and use cases (BI tools, operational applications. This is made possible by continuous metadata analytics to build the web layer. It integrates data processing processes and many sources, types, and locations of data.

Differences Data Fabric from the standard data integration ecosystem:

The Data Fabric architecture depends on individual data needs and queries of business. However, there are 6 main levels:

  1. Data management (ensuring management and security processes);
  2. Receiving data (determining the relationship between structured and unstructured data);
  3. Data processing (only relevant data extraction);
  4. Data orchestration (data cleansing, transformation and integration);
  5. Data discovery (identifying new ways to integrate different data sources);
  6. Access to data (the ability of users to explore data using BI tools).

 When implementing Data Fabric, you need to consider:

DataLabs is a Qlik Certified Partner. A high level of team competence and an individual approach allows to find a solution in any situation. You can get additional information by filling out the form at the link

GoUp Chat