
Anyone Can Show Margin Fell. The Job Is Explaining Why.
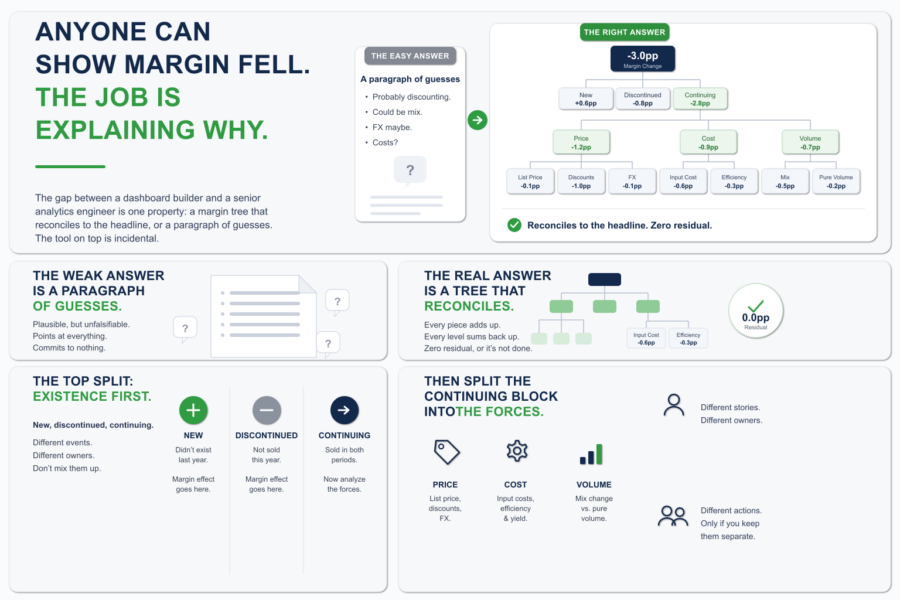
Margin is down three points. The CFO knows that already. The dashboard told them, the board deck told them, the number is not in dispute. What they wa...

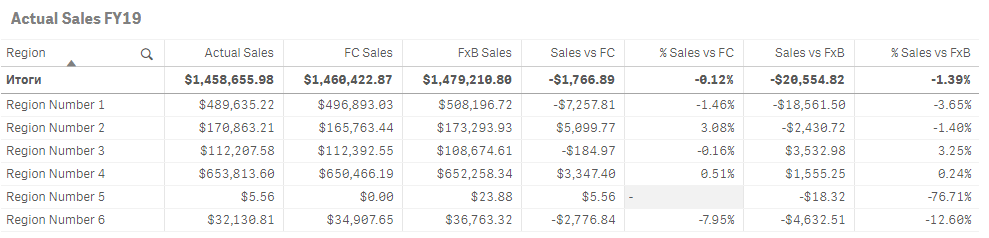
Set Analysis is an advanced way of the aggregation scope definition provided by Qlik BI products. Such aggregation area may differ from the current selection, may use it, or apply set operations to selections such as union, exclusion, or symmetric difference. So, it is a kind of «filter» that allows user to analyze indicators for different conditions. Such an analysis is useful when it is necessary to provide dynamic determination of values with a breakdown by dimensions. For example, sales volume of a certain product in different regions. As a rule, sales volumes are compared with forecasted sales and are determined from relative and absolute deviations.
Expressions for such analysis are defined by the developer using formulas. Their structure is based on the use of set analysis lexis and one or more aggregate functions (Sum, Max, Min, Avg, Count or Aggr) in relation to a certain indicator.
Prior to the August 2022 update, a set analysis expression had to be placed directly in the aggregate function arguments. This made it somewhat more difficult to write a general formula for an expression, especially when several aggregation operations are involved in the calculations. As a rule, in the latter case, the set analysis for each aggregation is the same or has a common part.
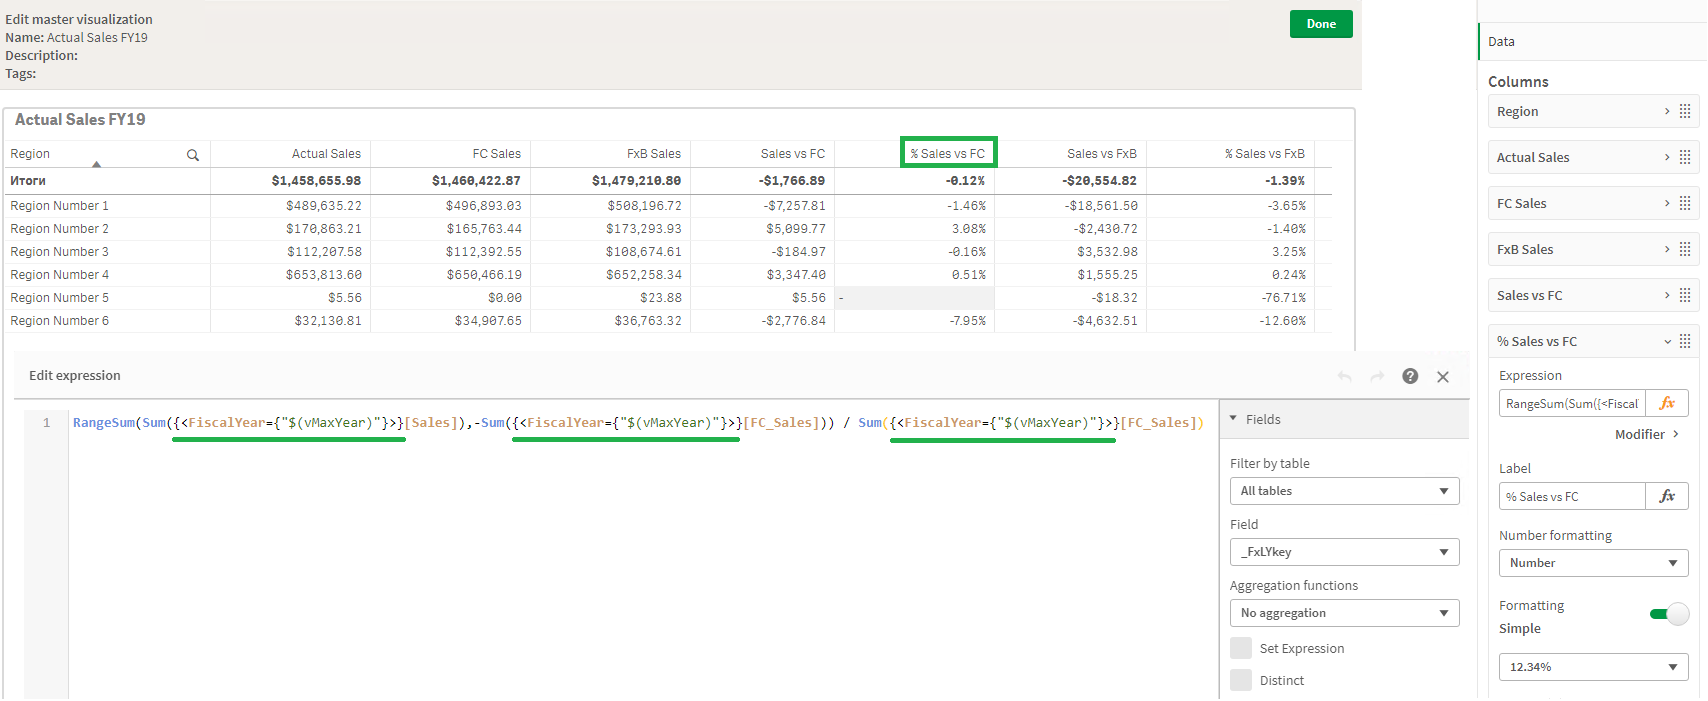
The presence of several identical parts in complex expressions makes the formula very cumbersome and difficult to understand and maintain.
Once upgraded, Qlik allows to externalize a set analysis expression and apply it to all subsequent aggregate functions. This provides backward compatibility for existing expressions and expands the possibility to use it.
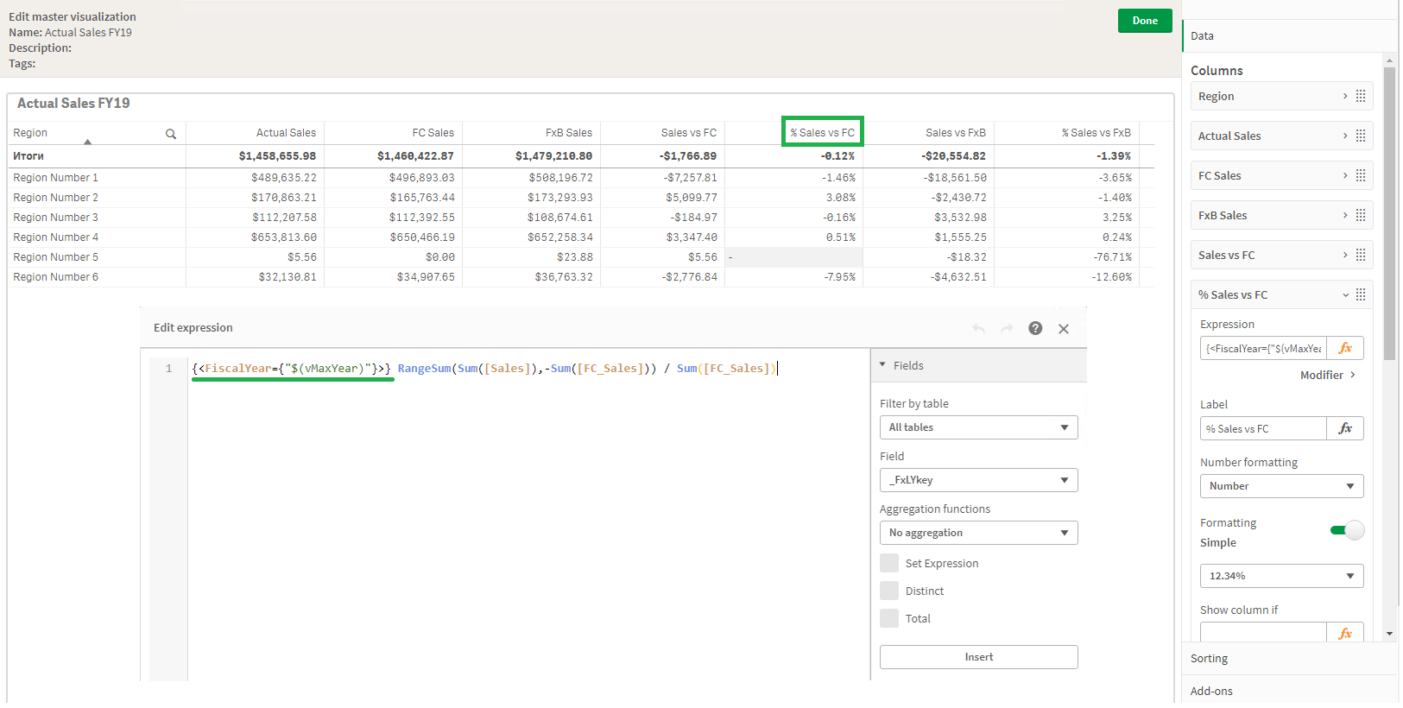
The main advantage of Qlik’s set analysis syntax is the reduction and simplification of formula writing. Clear and simple code significantly speeds up the development process. The simpler the code is written, the faster and easier it can be parsed and effectively maintained.
Margin is down three points. The CFO knows that already. The dashboard told them, the board deck told them, the number is not in dispute. What they wa...
At some point, every BI team that grows past three or four developers hits the same moment. Deployment coordination starts eating senior time. Small i...
The Qlik ecosystem is at an inflection point. AI systems and automated pipelines are starting to consume analytics output as input, not just present i...
No comments yet.
Leave a comment