
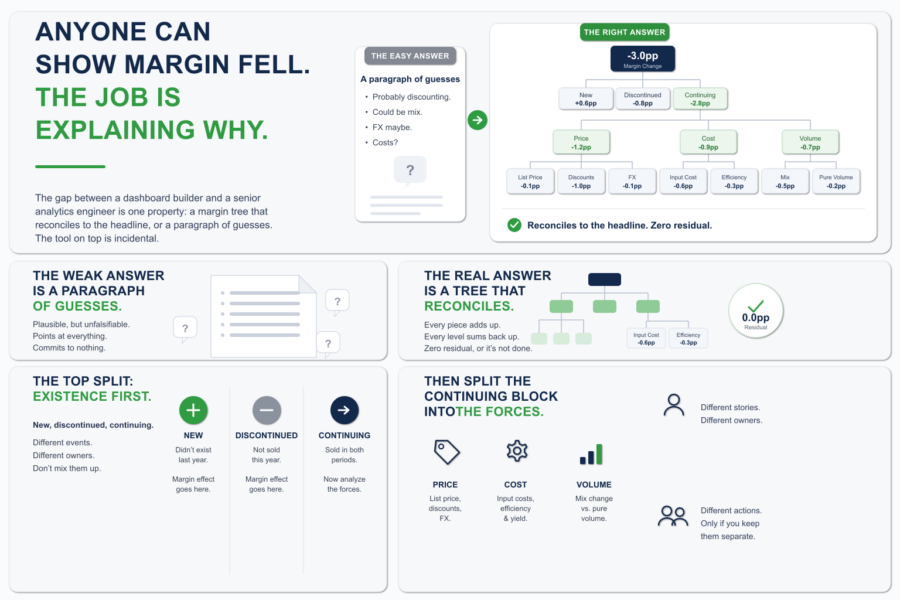
Anyone Can Show Margin Fell. The Job Is Explaining Why.
Margin is down three points. The CFO knows that already. The dashboard told them, the board deck told them, the number is not in dispute. What they wa...

Data by itself is not too valuable. What makes it valuable is analytics and insights. Data analytics helps to get the current situation, draw the right conclusions and make decisions that will lead to more efficient business activity and growth.
Let’s consider a car example. Often, we do not think about how it works, but we know that it can go wrong. It is possible to identify the causes and prevent them using analysis. It is enough to collect 2 datasets: the first is about car workflow and the second is about time when the car fails. Such dataset analyzing will help to understand what actions lead to failure and identify ways to prevent recurrence in the future.
Descriptive analytics
Data scientists call the analytics in the example above «descriptive». The result of this analytics type is the description of «what?», «when?» and «why?» happened. However, it does not offer possible solutions.
Now modern companies mostly use descriptive analytics. Specialists get access to the full amount of information in the form of graphs, charts, tables, reports that show the recurrence number of a particular event. This can be interaction with a client, a mechanical failure, sales, etc. Next, the specialist’s task is to analyze all information and develop the action plan.
A good example of descriptive analytics is Google Analytics. This tool perfectly visualizes indicators of site traffic, its load, user behavior on the site and much more. Descriptive analytics can be useful when used strategically.
Predictive analytics
The goal of many companies that adopt artificial intelligence and machine learning technologies is to enable predictive analytics.
An idea if predictive analytics is to analyze data about what has already happened and make predictions. Let’s go back to the car example. There is problems report from January to March. Prediction algorithm provides information on how and when a machine may fail in the future.
The result of predictive analytics is a set of probabilities that do not give 100% confidence that an event will definitely happen in the future. However, having such information, it is possible to prepare, check the availability of spare parts for repairs and develop a «plan B».
Predictive analytics is actively used by banks and lenders to assess risks. In consequence of analytics bank employees receive an estimate of the payment likelihood by a particular applicant and can compare it with risk thresholds.
Until recently, only advanced companies could implement analytical technologies and evaluate benefits. Now these companies are moving to «prescriptive analytics».
Prescriptive analytics
So, predictive analytics provides an answer to the question «what can happen», but does not answer the question «what to do to obtain the optimal result?» The next step in analysis is prescriptive analytics.
The predictive analytics system provides a number of possible outcomes. This can be effective when the specialist exactly knows the effective solution. For example, choose a specific action to increase sales. However, if the goal is to increase revenue in general, it is necessary to know the most effective measures package. This is where prescriptive analytics can help.
Let’s take autonomous vehicles as an example. The car must «know» that the fastest left/right turn can be lengthened by heavy traffic for a certain period. In this case, it is necessary to choose the best option and «register» it to the computer that drives the car.
With prescriptive analytics, the person driving the machine can know not only the cause of the failure, but also the best way to minimize such situations.
The 3 levels of analytics described above are fundamental to the automation process. Until recently, advanced predictive and prescriptive analytics technologies were prohibitively expensive for most companies. Now there are a large number of analytical tools and platforms that small organizations can afford. Gradually progressing through the analytics levels contributes to a successful digital transformation.
Margin is down three points. The CFO knows that already. The dashboard told them, the board deck told them, the number is not in dispute. What they wa...
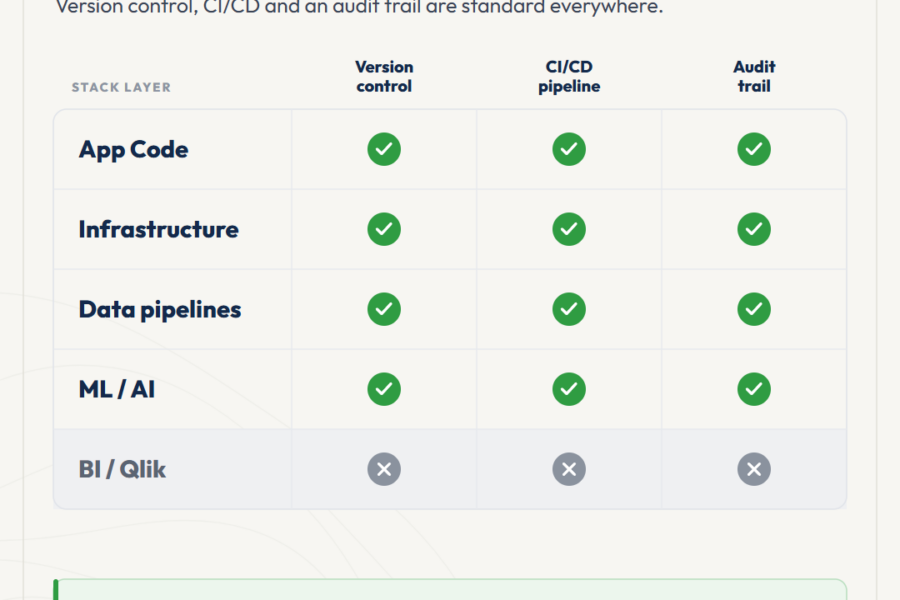
At some point, every BI team that grows past three or four developers hits the same moment. Deployment coordination starts eating senior time. Small i...
The Qlik ecosystem is at an inflection point. AI systems and automated pipelines are starting to consume analytics output as input, not just present i...
No comments yet.
Leave a comment