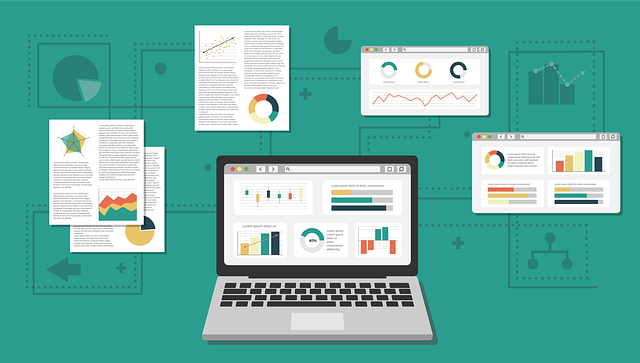
There are many BI tools that provide the transformation of business information into a form ready for business analysis. One such tool is the dashboard.
Dashboard is a BI tool that allows to track, analyze and report on all business performance metrics. Such a panel usually provides data visualization in the form of charts, graphs and maps. The simple and clear information presentation helps users understand it, share with other users, and work together on it. Dashboards also make it easy to connect data from many different sources. This allows users to explore and analyze data in one place.
BI-dashboard benefits:
- obtaining comprehensive answers to business questions;
- the ability to draw conclusions to make more effective decisions;
- raw data transformation from several sources into useful information;
- improving information literacy level and the quality of user interaction with data;
- improving the quality of employees’ work due to clear and convenient data visualization.
The main stages of dashboard creation:
- Data integration. The first step is to collect the raw data and transform it into analytics-ready information. The process of data transformation involves the connection of data from various sources and replication, various data types transformation into standardized formats.
- Goal definition. For the correct dashboard creation, it is necessary to clearly define the business goal, to define what exactly needs to be analyzed, researched and optimized. The goal may be to enter new markets, optimize some business processes, determine the priority stage of the marketing funnel etc.
- Simple and clear visualization. The data history should be transparent and understandable. It is important to identify key performance indicators and dependency, and choose graphs, charts, and maps that most accurately visualize this.
- Research and collaboration. Self-service provides business users with possibility to organize their own information investigation, draw conclusions and find new solutions. Modern BI tools that offer an associative engine allow to define all dependencies and not be limited to linear queries.
- AI usage. Modern dashboards offer advanced analytics capabilities, that uses AI and machine learning. The tools enhance users’ intuition and suggest new ideas.
DataLabs is a Qlik Certified Partner. A high level of team competence and an individual approach allows to find a solution in any situation. You can get additional information by filling out the form at the link
