
Margin is down three points. The CFO knows that already. The dashboard told them, the board deck told them, the number is not in dispute. What they want from you is the next sentence, and the next sentence is where dashboard builders and senior engineers stop looking alike.
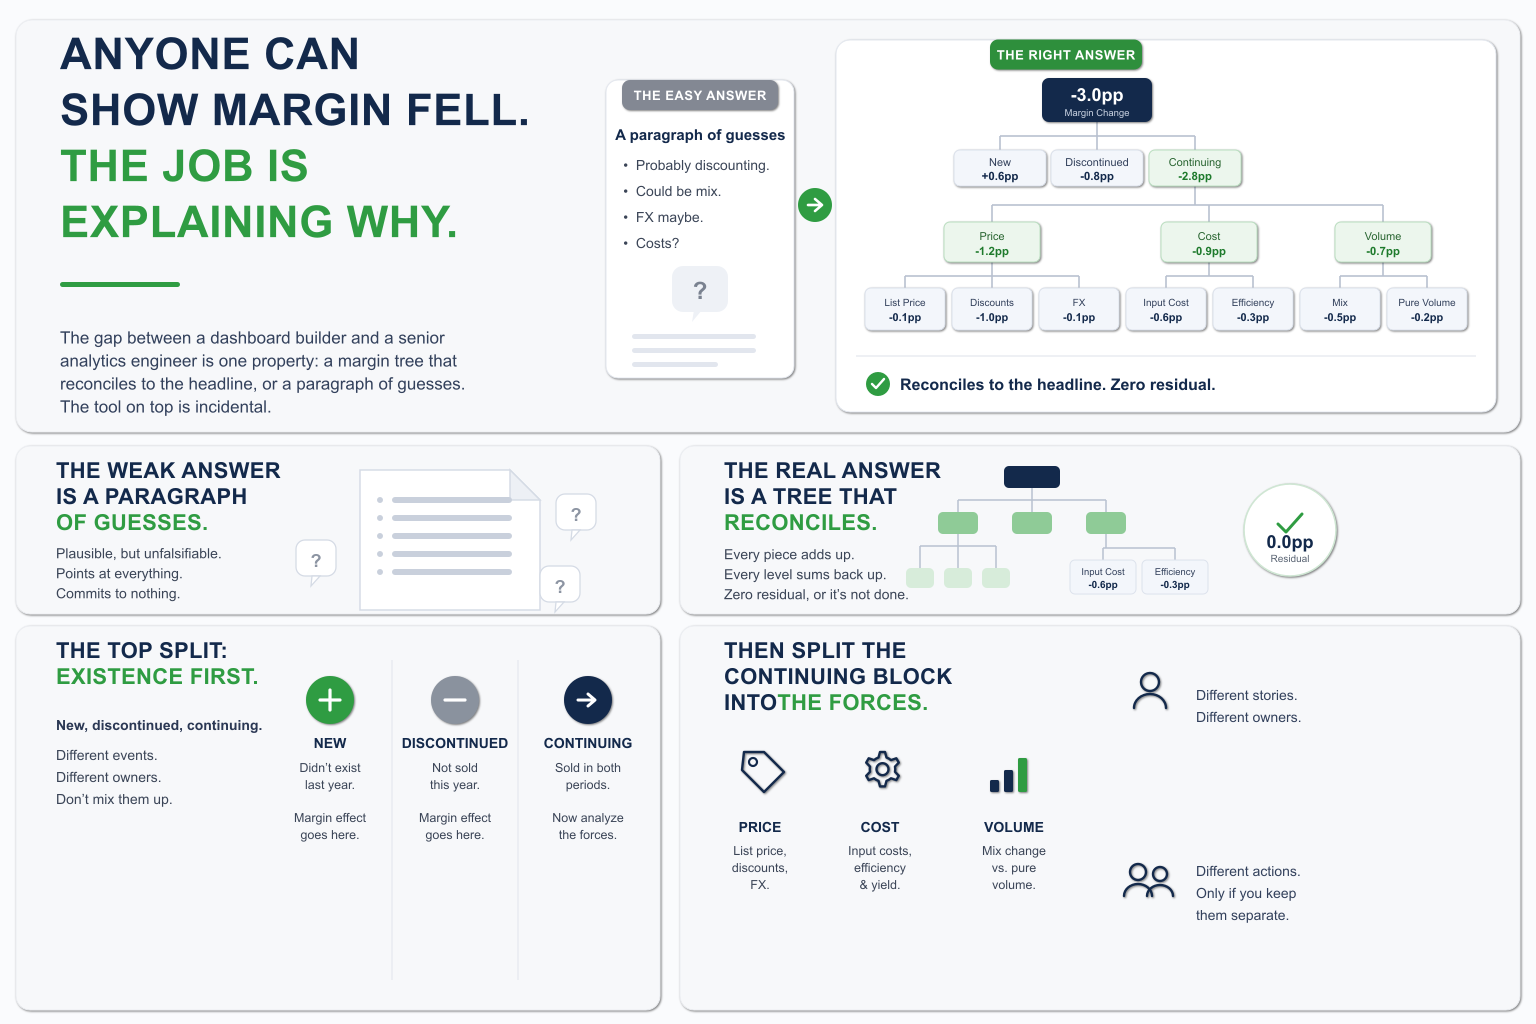
The weak answer is a paragraph of guesses. Probably discounting. Could be the new product line, those margins are thinner. FX maybe. Each clause is plausible, none of it adds up to the three points, and a week later someone in finance has quietly redone the math and reached a different conclusion. The paragraph was not wrong so much as it was unfalsifiable. It pointed at four things and committed to none, which is another way of saying it pointed at nothing.
The real answer is a tree. One number at the root, the headline drop. Branches that each carry a piece of it. Leaves that each name a force you can do something about. And the property that makes the whole thing worth building: every level sums back to the level above it, all the way up to the three points, with nothing left over. Not roughly. Exactly. A material residual at the bottom is not a rounding nuisance you wave away. It is the tree telling you it is lying about something, and you do not yet know what.
That property – reconciles to the headline with zero residual, or it is not done – is the entire difference. It is what separates a model from a story about a model. Anyone can produce the story. The reconciling tree is the job.
Start at the top and the first cut is the one most people skip, which is why most margin explanations are quietly broken before they begin.
Before you talk about price or cost or volume, you have to account for the fact that this period is not selling the same things to the same people as last period. Some product and customer segments are new this year. Some you discontinued. The rest continued in both periods. Those three groups do not decompose the same way and you cannot pretend they do. A segment that existed last year and is gone now did not have its price fall to zero or its volume shrink to nothing. It left. That is a different event with a different owner, and folding it into a price effect or a volume effect corrupts both.
So the top split is existence first: new, discontinued, continuing. Set the new and discontinued segments aside as their own branches, each carrying the full margin they added or took with them. Then, and only then, take the continuing block apart into the three forces everyone reaches for too early: price, cost, volume.
Price is not one thing. Price is your list price, minus the discounts and rebates your sales team actually granted, adjusted for the currencies you billed in. Three different stories live in there. List price held flat while discounts crept up is a sales problem. List price cut to defend a position is a strategy decision. A currency moving against you is nobody’s fault and not fixable by anyone in the building. Collapse them into one “price” number and you have told the CFO that price did something without telling them who, if anyone, should be in the room.
Cost splits the same way. What your raw inputs cost is one force. How efficiently you turned those inputs into product is another. Input inflation is a procurement and supplier conversation. Efficiency and yield are an operations conversation. Same branch, two different doors, two different people.
Volume is the one that hides the most. Selling more is not the same as selling a different mix, and the second one is invisible if you do not pull it out on purpose. You can sell the exact same total units and watch margin move several points, purely because the share shifted toward a thinner product group or a heavier-discount customer group. Pure volume is selling more of the same. Mix is selling a different blend. A manager can act on each one, but only if you have held them apart. Blurred together, they read as “volume was fine” while a mix problem eats the quarter.
Now run a real one through. The CFO says margin is down three points and asks why, and instead of a paragraph you hand back a tree.
List price held flat. So the drop is not pricing strategy, nobody decided to give margin away at the top. It is discount leakage, and the tree concentrates it in one customer group your reps over-served to make quota. That is a sales lever, one conversation with one regional manager. Meanwhile the cost branch shows input inflation landing on a single product group and nothing else, which is a procurement lever, a different person, a different door. And under volume, the tree shows you traded two profitable segments for a wave of low-margin volume. The top line went up, which is why nobody flagged it, but the mix shift cost you more than the extra revenue brought in.
One number went in. A to-do list for three different departments came out: a conversation for sales, a conversation for procurement, a flag for whoever owns the product portfolio. Each one specific, each one sized, each one tracing back to a leaf that sums into the three points. That is what the CFO actually needed. Not a chart that confirms margin fell, which they had, but the handful of levers that explain it and the names of the people who can move each one.
Up to here it sounds like a recipe, and recipes do not pay top of band. The seniority is not in knowing the branches exist. It is in three places where the tree quietly lies if you get them wrong, and a junior almost always gets at least one wrong, because each one looks like a detail and is actually a fork.
The first is the cross-term. Price and volume both move in the same period, and there is a slice of margin that belongs to the two of them moving together. You can attribute it to price or you can attribute it to volume, and there is no law of nature that says which. What there is, is a rule: pick one convention and apply it to every driver in the tree, or the slice gets double-counted and a residual shows up at the bottom that you cannot explain. The math is not the hard part. The discipline is. One base, everywhere, stated out loud so the next person knows which one you chose. Half the broken bridges I have seen broke here, and they broke silently, because the residual was small enough to look like rounding and large enough to be a wrong conclusion.
The second is the existence check, and it is the one that separates people who have built these before from people reading about it. A continuing segment is one with volume last period and volume this period. A discontinued one has volume last period and none now. The trap is the cell that had real volume last year and simply has no rows in the current data. The naive query treats absent rows as zero. Now you have a segment whose volume “fell” from a real number to zero, and the tree reads that as a catastrophic volume collapse in a continuing segment, when what actually happened is the segment was discontinued and belongs in a different branch entirely. Prior volume and no current rows means discontinued, not zero. Get that one check wrong and the volume branch is fiction, confidently presented, summing perfectly to a headline it has no right to explain.
The third is mix, and this is the one where you have to be willing to say “I made a choice.” When you split mix into product mix and customer mix, those two numbers are not unique. There is a piece where the product shift and the customer shift interact, and depending on which dimension you compute first, that piece lands in one or the other. Compute product first and product absorbs it. Compute customer first and customer does. The total is the same either way, but the two component numbers a manager reads off the slide change depending on an order you chose and probably did not mention. The senior move is not to find the one true answer, because there is not one. It is to pick a convention, usually folding the interaction into whichever dimension the business actually steers by, and to say so on the slide. A junior presents the two numbers as facts. A senior presents them as a stated convention, because they know someone will recompute it the other way and get different numbers and accuse the model of being wrong.
None of these three is exotic math. That is the point worth sitting with. They are judgment calls that look like footnotes, and each one is the difference between a tree that reconciles and a tree that hands a manager a clean-looking number with a wrong department attached to it. The model that lies does not announce that it is lying. It returns a number. It does not error, it does not crash, it sums to something close to the headline, and a regional VP reads it on Thursday and goes off to defend a price when the real problem was mix. The cost of the wrong convention is not an ugly chart. It is a wrong decision made confidently on a number that looked finished.
Two things have to live in one person for this tree to be right, and they almost never live in one person.
One is the business. You have to know why the CFO wants margin decomposed at all, what decision rides on it, which split actually matters this quarter given how the incentives are set. Decompose along a seam nobody can act on and you have built something technically flawless and operationally useless: a tree that balances perfectly and still sends the wrong manager to fix the wrong thing. The math is right and the conclusion is still worthless.
The other is the craft. You need the set analysis or the DAX that isolates discount leakage to one customer group without dragging the rest of the book in. A data model that holds mix and volume apart instead of averaging them into one comforting number. Existence logic that knows a discontinued segment from a continuing one. One convention threaded through every driver so the bottom reconciles. That is real technical depth, the kind that takes years, and on its own it builds a beautiful tree pointed at the wrong question.
And notice that none of it is a Qlik trick or a Power BI trick. The same bridge reconciles in set analysis, in DAX, in plain SQL, in a notebook. The tool is just where you write the model down. What is scarce is the judgment that makes the tree both reconcile and point at the right person, and that judgment does not belong to a platform. It travels with the engineer across every one of them.
A junior tends to have a usable amount of one and a thin amount of the other. They write the set analysis and pick the wrong seam, or they know the business cold and model it in a way that does not reconcile. The two halves rarely sit in the same head, and that is the whole point. When you find the person who has both at full strength, the output is not a dashboard that confirms what everyone already saw. It is a decision a manager can carry into a room and defend, with the names of the people who can move each lever already on it. That is a different kind of engineer.
So here is the frame worth keeping, and it is portable past margin to any number a manager stares at and asks why.
A dashboard builder answers “what.” The number, the trend, the chart that shows margin fell. Useful, necessary, and not the job. A senior analytics engineer answers “why” in a form a manager can act on: a tree, existence-aware at the top, split into forces that each map to a real owner, every leaf reconciling to the headline with zero residual, every judgment call named out loud so the next person can check it. One number in, a to-do list for three departments out, and every line of it true enough to bet a budget on.
That is the bar. Not a prettier chart. A model that takes a question apart so cleanly that the answer points at people by name and survives someone redoing the math.
This is the work I do, whatever sits on top. Qlik, Power BI, the warehouse underneath: the platform is the part that takes a week to learn. The hard part, the part that took years, is turning a number a manager keeps staring at into a tree they can act on, with every leaf reconciled and the right name on each lever. If that is the gap on your team, in any stack, that is what I get brought in for. That is what DatalabsUa does.
If you have a number that will not explain itself, find me on LinkedIn and walk me through it.

No comments yet.
Leave a comment