
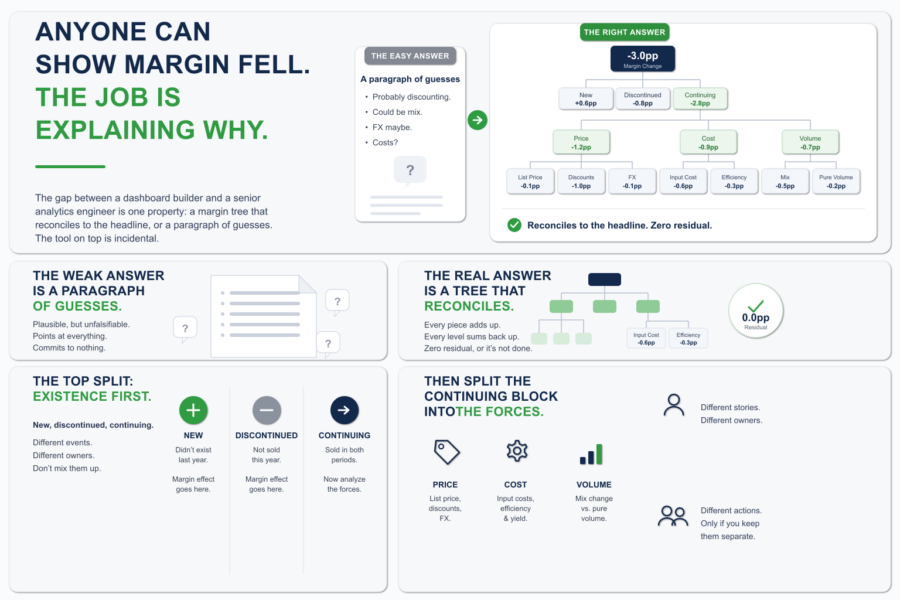
Anyone Can Show Margin Fell. The Job Is Explaining Why.
Margin is down three points. The CFO knows that already. The dashboard told them, the board deck told them, the number is not in dispute. What they wa...
Effective organizatio operation largely depends on the financial management. The finance team, led by the chief financial officer (CFO), is responsible for managing the business’s financial flows, financial planning and reporting, setting financial policies and ensuring financial strength. Financiers use various BI tools to effectively perform their duties. One such tool is the financial dashboard.
Financial Dashboard is a BI-tool that allows employees in the finance department and/or financial institutions to visualize, track, and report on key financial metrics. Modern panels use financial analytics to synthesize disparate financial and accounting data. This allows to conduct a detailed study of the data to draw the right conclusions and make effective decisions.
Financial analytics tools allow each user to create his own dashboard and include the indicators he needs (return on assets, return on equity, ratio of debt and equity, equity working capital, etc.).
Features of financial dashboards:
Combining data from multiple sources, the dashboard allows the user to get a complete and accurate financial picture, conduct sophisticated real-time financial data analysis, forecasts, budget and plan.
DataLabs is a Qlik Certified Partner. A high level of team competence and an individual approach allows to find a solution in any situation. You can get additional information by filling out the form at the link
Margin is down three points. The CFO knows that already. The dashboard told them, the board deck told them, the number is not in dispute. What they wa...
At some point, every BI team that grows past three or four developers hits the same moment. Deployment coordination starts eating senior time. Small i...
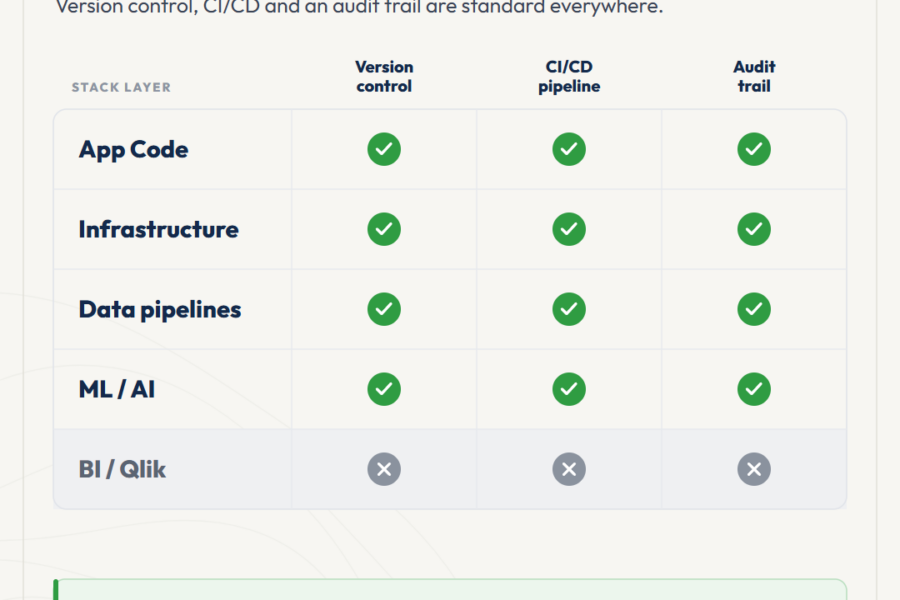
The Qlik ecosystem is at an inflection point. AI systems and automated pipelines are starting to consume analytics output as input, not just present i...
No comments yet.
Leave a comment