
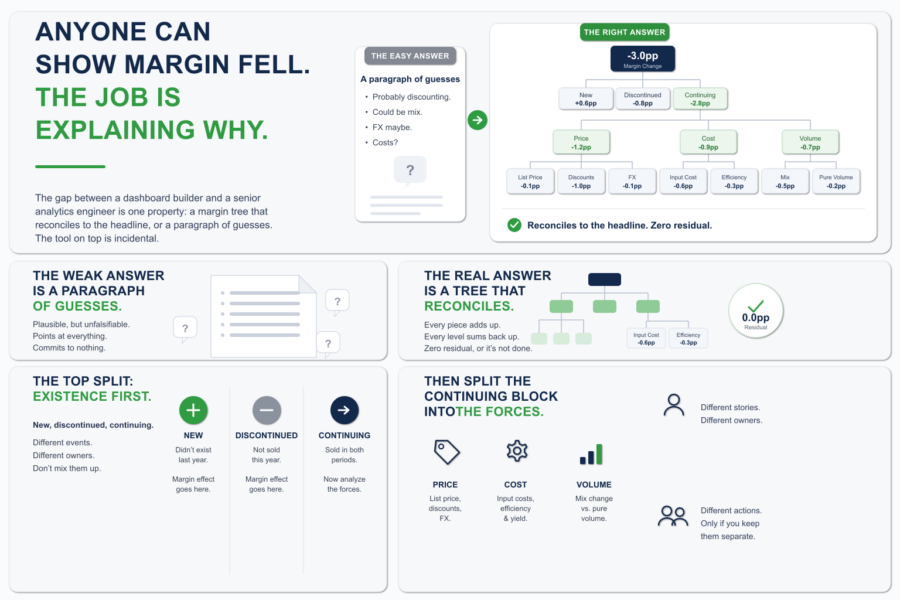
Anyone Can Show Margin Fell. The Job Is Explaining Why.
Margin is down three points. The CFO knows that already. The dashboard told them, the board deck told them, the number is not in dispute. What they wa...

Any company is interested in buying the product it produces and using the service it provides. The profit of the company directly depends on the sales level and is the ultimate marker of the sales department success. The issue of increasing sales level worries everyone and always. So, it is important to analyze all the factors that affect level of sales: quality of contacts, response time to a call, effectiveness of each sales channel, level of competition, changes in buying behavior, repeat sales rate, etc. An effective and detailed analysis of all factors can be carried out with using the Qlik tool – sales dashboard.
Sales Dashboard is a BI tool that allows sales teams to explore key performance indicators and share up-to-date information with colleagues and stakeholders. Such a dashboard can be integrated with CRM, marketing and financial systems. This allows to get real information, analyze it and make more accurate forecasts based on this, make more deals and increase profits.
Sales dashboard examples:
DataLabs is a Qlik Certified Partner. A high level of team competence and an individual approach allows to find a solution in any situation. You can get additional information by filling out the form at the link
Margin is down three points. The CFO knows that already. The dashboard told them, the board deck told them, the number is not in dispute. What they wa...
At some point, every BI team that grows past three or four developers hits the same moment. Deployment coordination starts eating senior time. Small i...
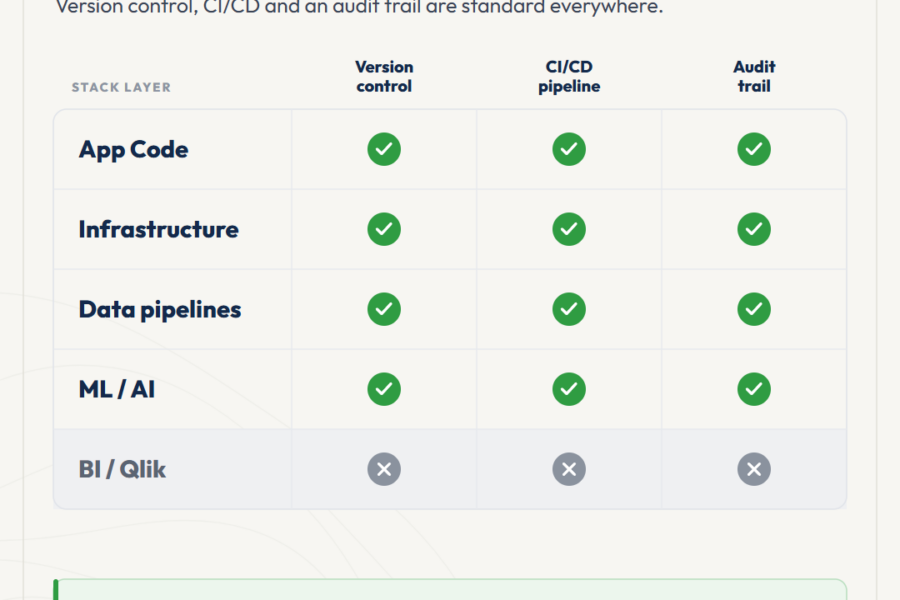
The Qlik ecosystem is at an inflection point. AI systems and automated pipelines are starting to consume analytics output as input, not just present i...
No comments yet.
Leave a comment