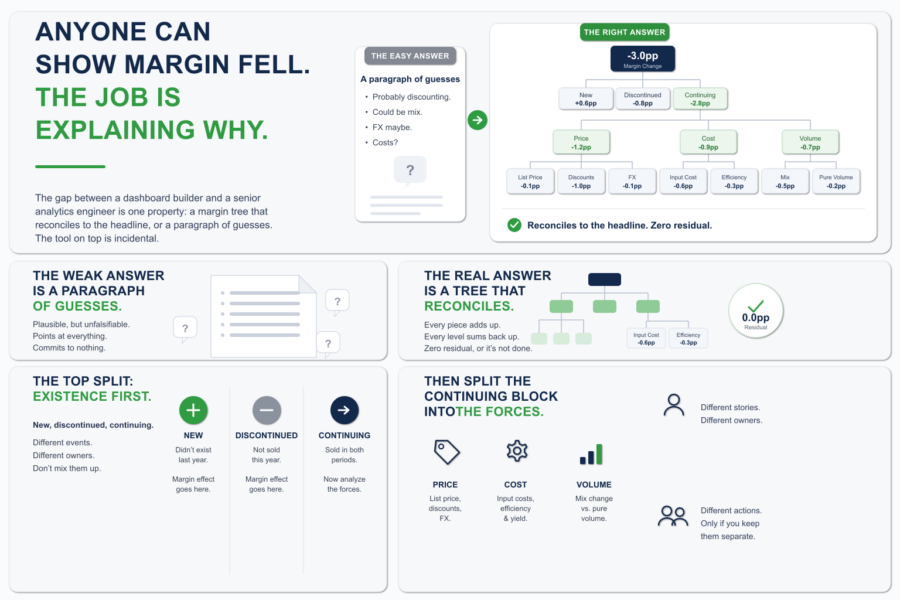
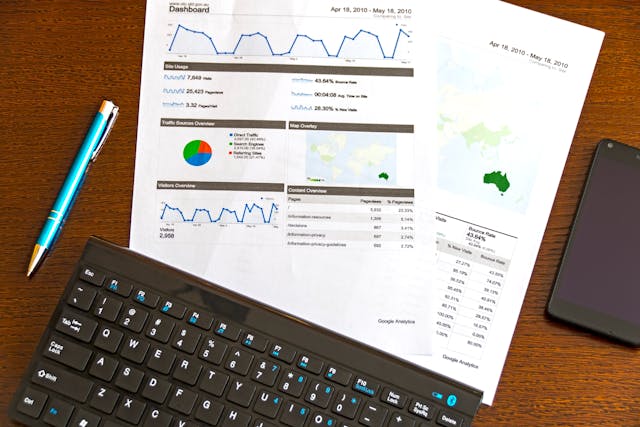
Visual presentation of data and key performance indicators in the form of graphs, charts and maps is carried out using dashboard software. Its main task is to help users combine large data amounts from different sources, identify patterns and transform data into decisions and actions.
According to Gartner, the leaders in the field of visualization, analytics and data integration are 3 providers: Qlik, Power BI and Tableau. They allow to create charts and graphs of any shape and size for detailed data exploration.
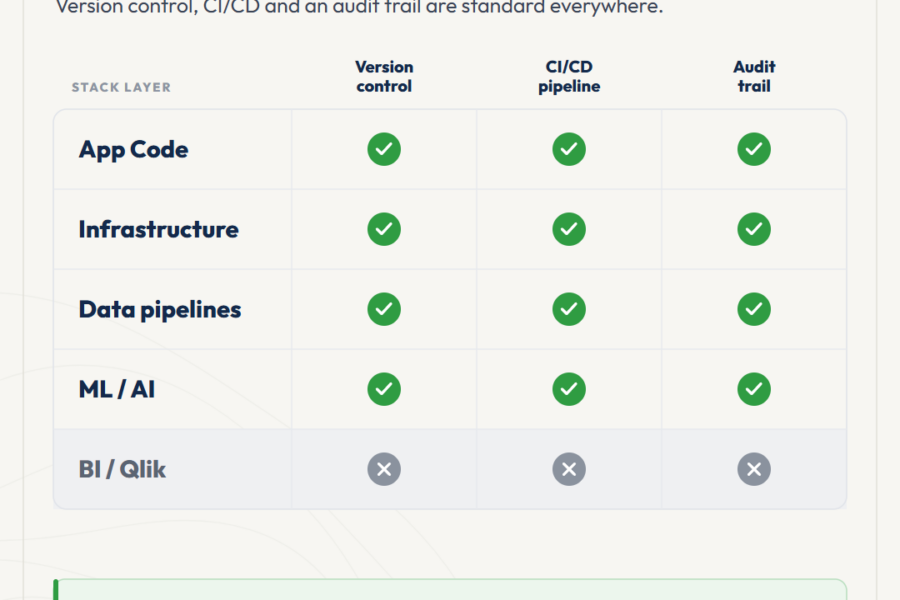
Comparison of 10 key tools features:
- Data Exploration: Dashboard software allows users to freely find, view and explore data.
- Qlik Sense: an associative engine allows free data analysis, a cognitive engine that uses machine learning to find decisions about what actions to take;
- Tableau: using a SQL database restricts users and allows them to follow a certain path within a small piece of data;
- Power BI: also uses a SQL database, which limits the user experience;
- Data visualization: create graphs, charts and maps, and use artificial intelligence to unlock the value of data more.
- Qlik Sense: provides a full range of interactive visualizations and makes them unique by compressing large datasets;
- Tableau: offers a full range of visualizations, but the user can filter and explore the data within the criteria specified by the author;
- Power BI: offers a full range of visualizations, but like Tableau, users are limited in filtering and exploring;
- Data Integration: Combining data from all sources into an easily accessible data catalog.
- Qlik Sense: has the best data integration capabilities for combining, transforming and cataloging data. Qlik also offers a data integration platform;
- Tableau: there are 2 data integration options – Tableau Desktop and Tableau Prep. Each tool is not universal and is designed to solve different problems. In this case, it is difficult to understand what tool to use;
- Power BI: Offers several standalone data integration tools that increase user investment;
- Work with large data amounts: the ability to process growing data volumes, extract data from multiple sources to obtain complete information in near real time.
- Qlik Sense: collect from multiple sources and quickly process large data amounts to get complete and fast answers; it is possible to update data by editing records;
- Tableau: complex process of processing large disparate data volumes, which reduces performance; inability to increase data;
- Power BI: there is a 1 GB size limit per dataset. Scaling will require additional costs to upgrade to a Premium offer or use a dynamic query;
- Deployment options: an ability of software to adapt to the strategy, regardless of which cloud architecture or platform is used.
- Qlik Sense: complete enterprise SaaS solution, on-premises and private cloud options;
- Tableau: is part of Salesforce, which makes you wonder where the data might be;
- Power BI: works only in Microsoft Azure;
- Management and self-service functions: Unlimited user experience in the process of data exploration through self-service Business Intelligence.
- Qlik Sense: unify and centralize data by creating secure, managed data models; content creation takes place in the cloud with the ability to manage and control;
- Tableau: creating multiple copies of content with small iterations, what requires more resources and time to manage different copies;
- Power BI: decentralization of data across the cloud and user desktops, making it difficult to manage data and validate it;
- Use of AI: productivity increasing, using advanced analytics to deeply explore data and gain valuable insights;
- Qlik Sense: an ability to use natural language to ask a question, get an answer to it, as well as get new ways to analyze data;
- Tableau: to extract value from data it’s necessary to connect to the business logic that is built into the workbooks;
- Power BI: Quick Insight and Q&A use AI and allow to analyze information using natural language;
- Built-in dashboards: an ability to work with data in applications; deploying analytics to business using a flexible platform and open APIs.
- Qlik Sense: using APIs to integrate different technologies (peripherals, workflows, products and portals), which allows you to embed a full-featured dashboard in a mobile application;
- Tableau: API offerings are quite limited;
- Power BI: the ability to embed dashboards and objects, but lacks powerful API functionality;
- Mobile functionality: the ability to explore and analyze using a mobile application with full functionality.
- Qlik Sense: a fully functional mobile application that provides users with all the necessary functions;
- Tableau: limiting users in their capabilities (for example, downloading one sheet of a workbook);
- Power BI: it is possible to get the most out of data only from a desktop;
- Information literacy: understanding a process of data research and visualization, the search for new ideas.
- Qlik Sense: a self-service tool that enables users to easily find information, analyze and create reports; information literacy as a service from Qlik integrates training, technology and processes, which increases the level of users’ information literacy;
- Tableau: support exclusively for authors;
- Power BI: self-service is available only for authors, other users have limited data generation capabilities.
DataLabs is a Qlik Certified Partner. A high level of team competence and an individual approach allows to find a solution in any situation. You can get additional information by filling out the form at the link

No comments yet.
Leave a comment