
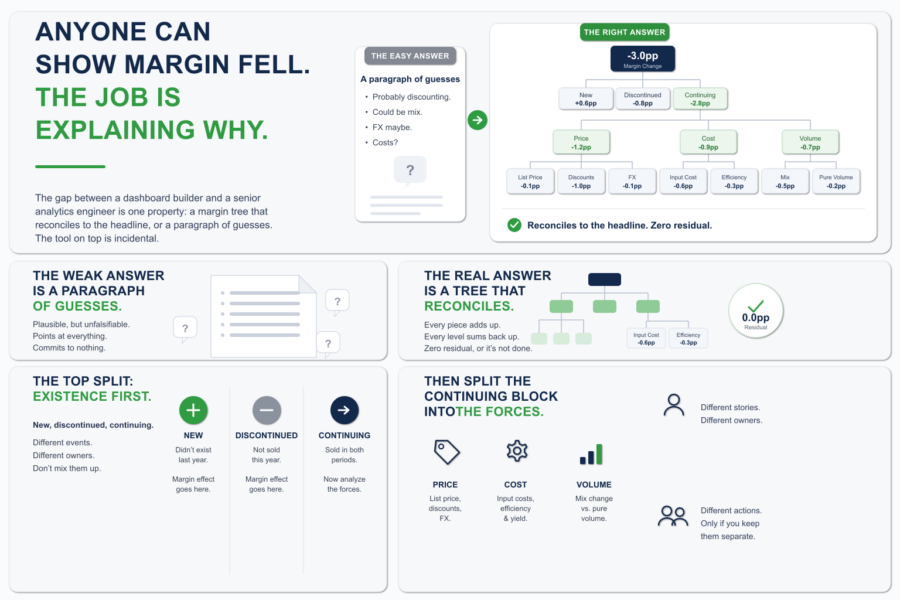
Anyone Can Show Margin Fell. The Job Is Explaining Why.
Margin is down three points. The CFO knows that already. The dashboard told them, the board deck told them, the number is not in dispute. What they wa...
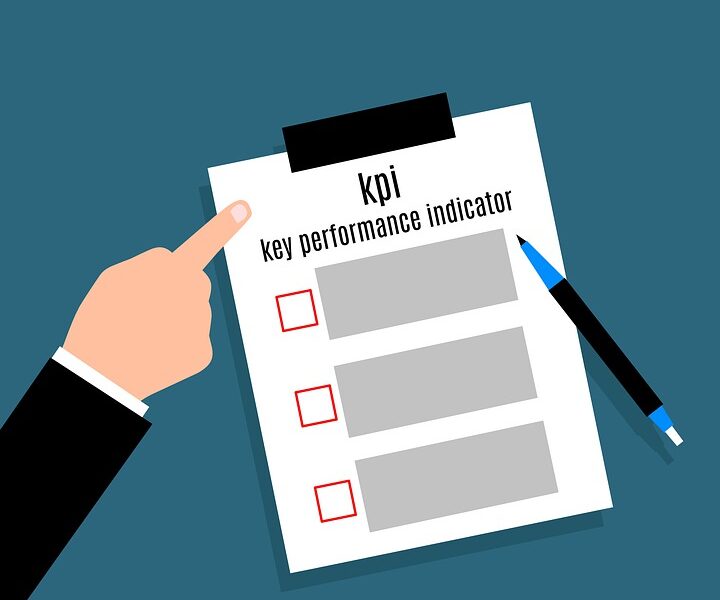
Key performance indicators (KPIs) are measures of a company’s performance that help achieve its strategic and operational business goals. Using these indicators it is possible to assess the current state of the business and the success of the strategy implementation, monitor employees activity, departments and the business as a whole, make effective decisions and move forward at a strategic level.
The KPI dashboard displays key performance indicators using interactive charts and graphs. This provides a fast and easy data workflow. Modern dashboards allow users to efficiently explore and analyze data, find the information they need, and get answers to business questions. Dashboards, by transforming large sets of business data into accessible and understandable information, help to improve business operations as a whole.
Each dashboard is unique and can be customized to users’ needs to detail the necessary information. However, there are 4 main categories of KPI dashboards:
Benefits of KPI dashboards:
To create a KPI dashboard it is necessary to:
Key principles for creating a KPI dashboard:
DataLabs is a Qlik Certified Partner. A high level of team competence and an individual approach allows to find a solution in any situation. You can get additional information by filling out the form at the link
Margin is down three points. The CFO knows that already. The dashboard told them, the board deck told them, the number is not in dispute. What they wa...
At some point, every BI team that grows past three or four developers hits the same moment. Deployment coordination starts eating senior time. Small i...
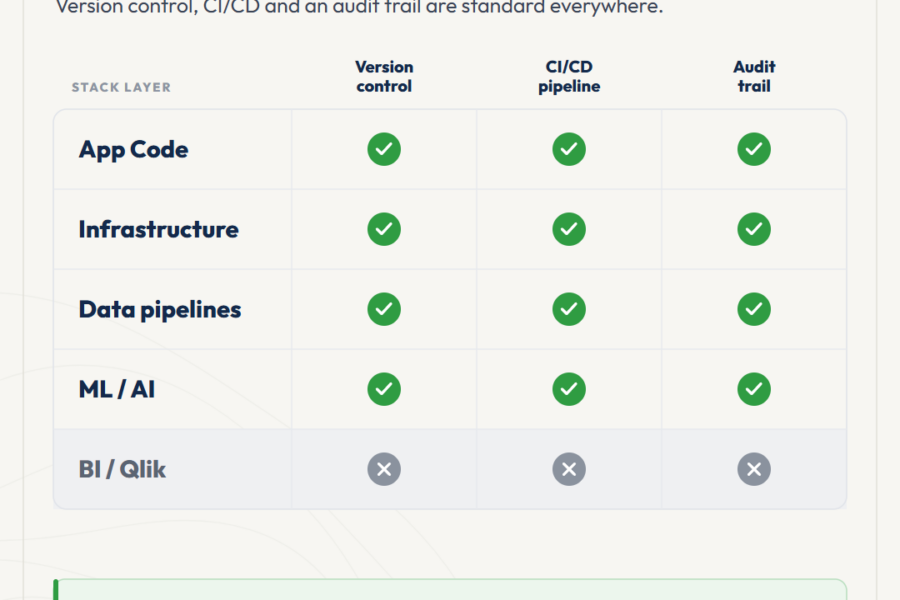
The Qlik ecosystem is at an inflection point. AI systems and automated pipelines are starting to consume analytics output as input, not just present i...
No comments yet.
Leave a comment