
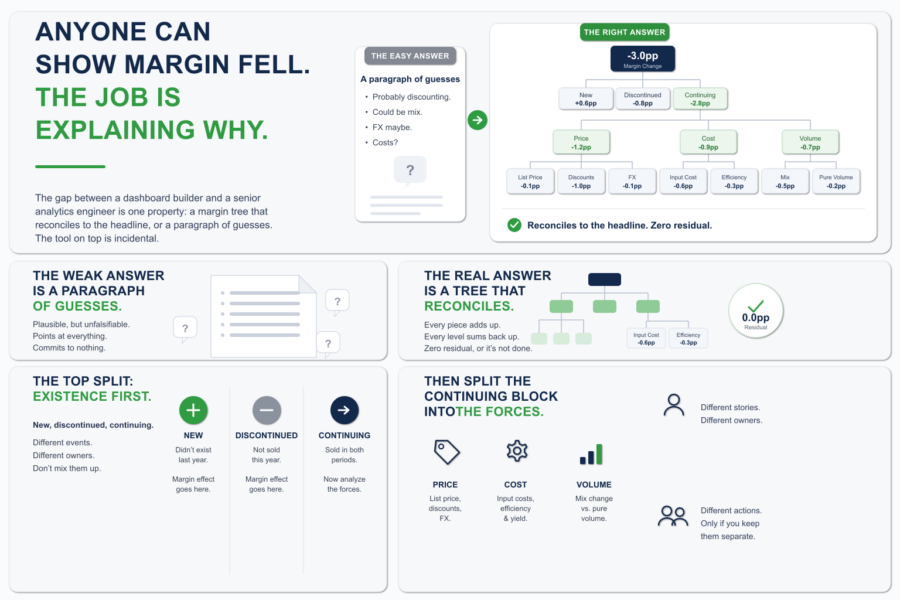
Anyone Can Show Margin Fell. The Job Is Explaining Why.
Margin is down three points. The CFO knows that already. The dashboard told them, the board deck told them, the number is not in dispute. What they wa...

Currently, one of the most promising and rapidly developing areas is visual analytics. Its advantage lies in the ability to work with large datasets, combining graphical visualization and powerful analytical calculations.
Visual analytics is the process of using sophisticated tools and methods to analyze data using visual data representations in the form of graphs, charts, and maps. This allows users identify patterns and insights that help them make better data-driven decisions.
Visual analytics is not just a graphic data representation and should not be confused with data visualization. State-of-the-art interactive visual analytics makes it easy to combine data from multiple sources and in-depth data analysis right in the visualization. The use of artificial intelligence and machine learning algorithms generate recommendations for a more detailed data study. The main task of this tool is to turn large data amounts into successful business ideas.
Visual analytics advantages:
Key recommendations for the qualitative use of visual analytics:
The large number of vendors that offer visualization features as part of the software makes it difficult to choose the right tool.
Modern data analysis tools include the following features:
DataLabs is a Qlik Certified Partner. A high level of team competence and an individual approach allows to find a solution in any situation. You can get additional information by filling out the form at the link
Margin is down three points. The CFO knows that already. The dashboard told them, the board deck told them, the number is not in dispute. What they wa...
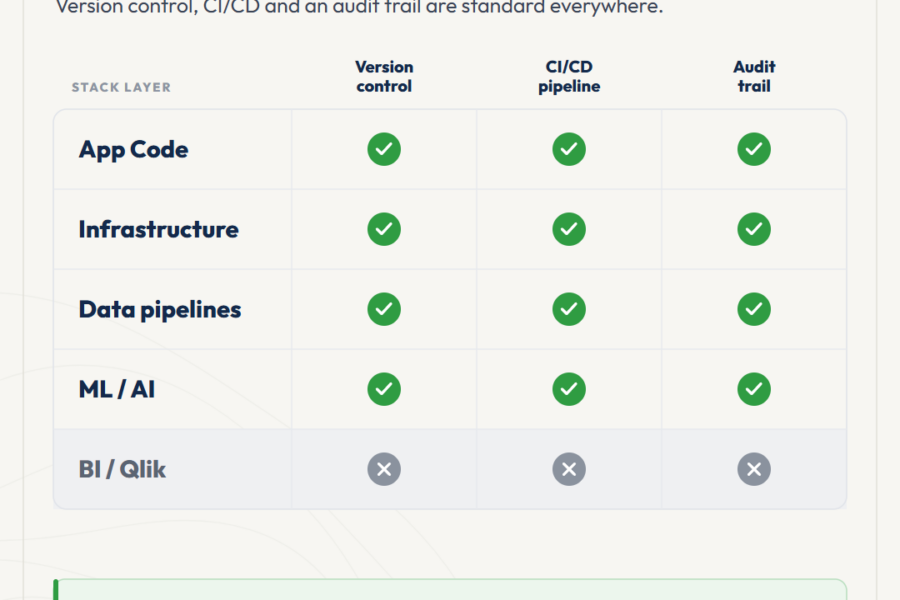
At some point, every BI team that grows past three or four developers hits the same moment. Deployment coordination starts eating senior time. Small i...
The Qlik ecosystem is at an inflection point. AI systems and automated pipelines are starting to consume analytics output as input, not just present i...
No comments yet.
Leave a comment